
Week 1
When you confirm your email
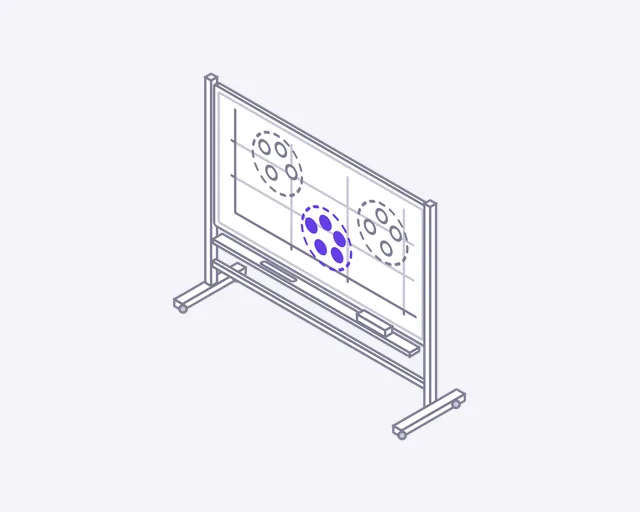
Clustering

Pie chart
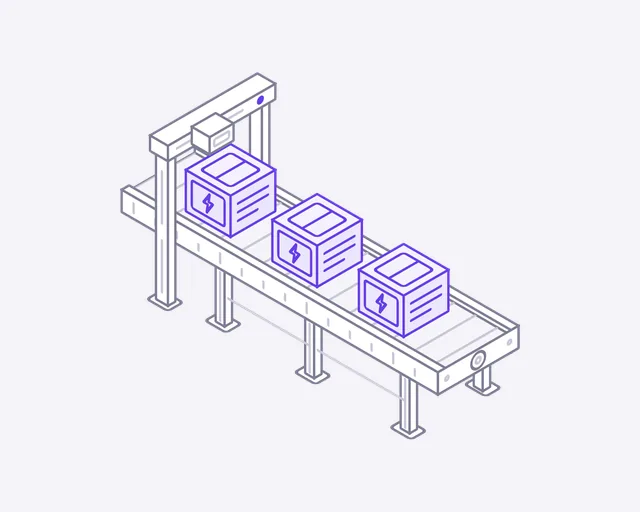
Event stream
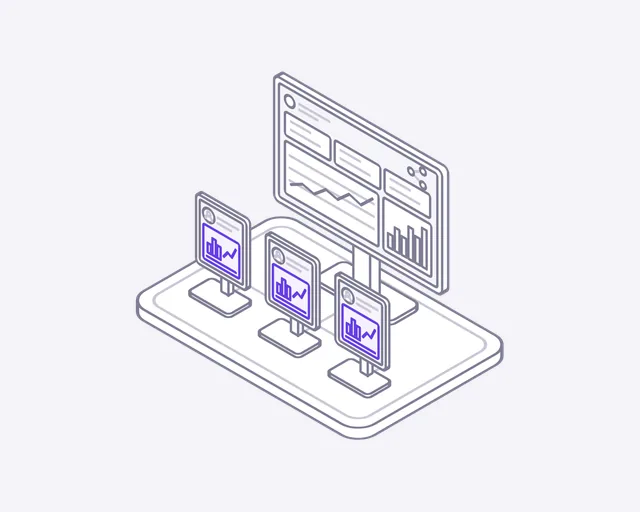
Shared dashboard
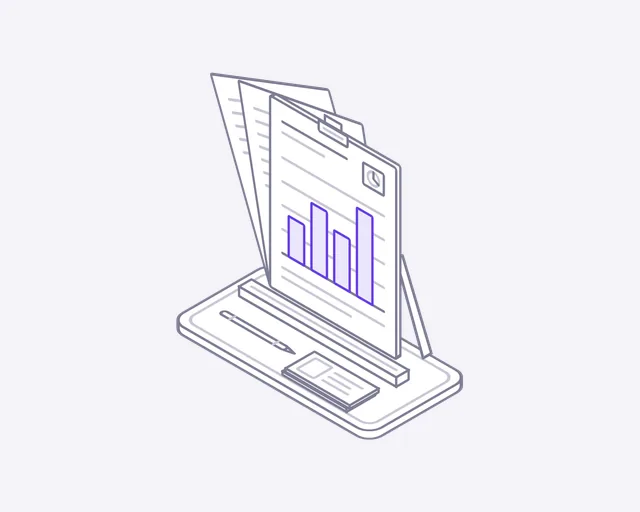
Report
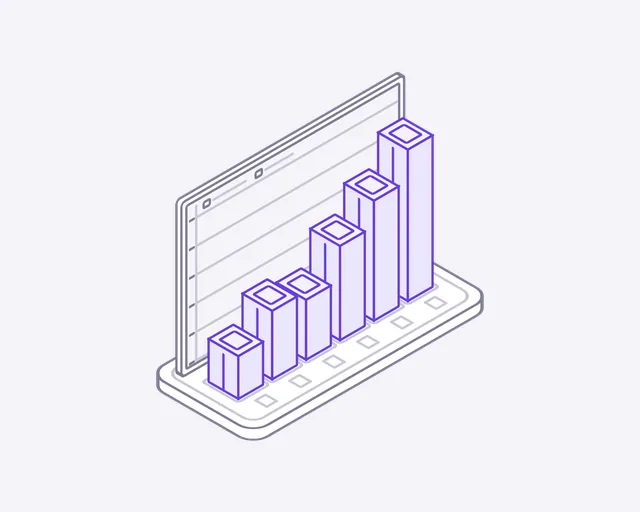
Bar chart
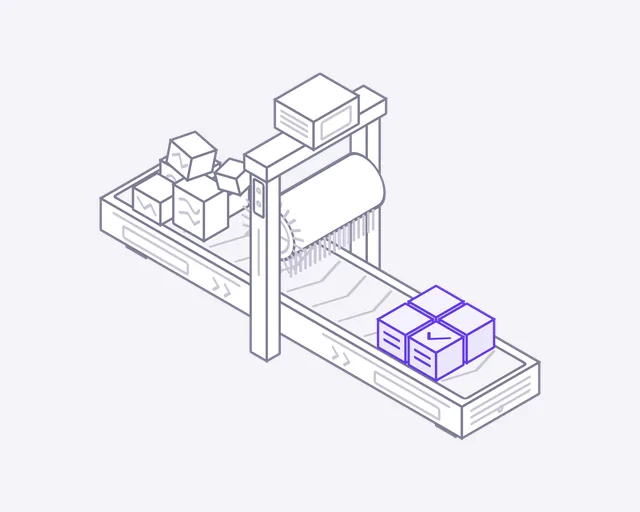
Data cleaning
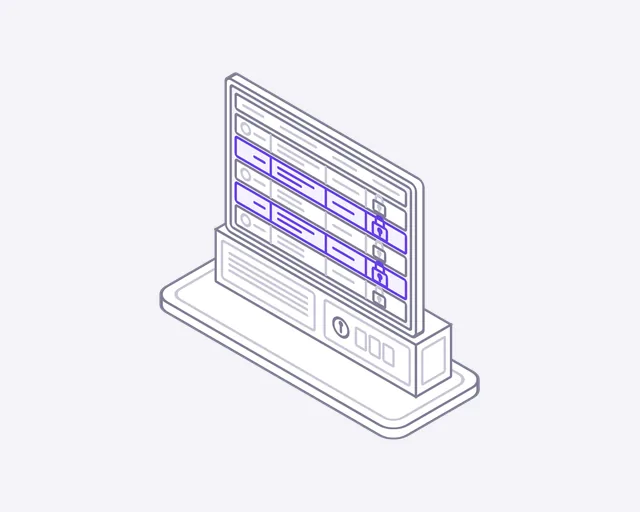
Access control
Week 2
One week later
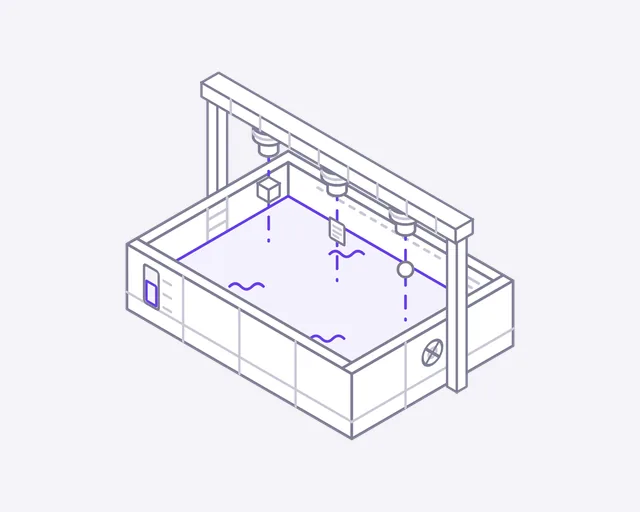
Data lake
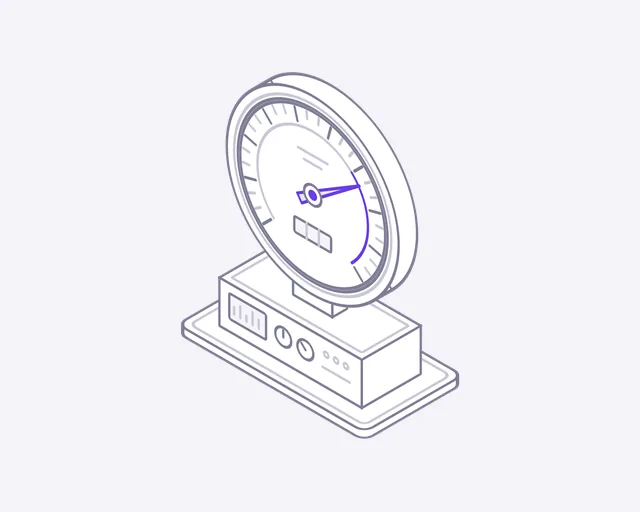
Gauge
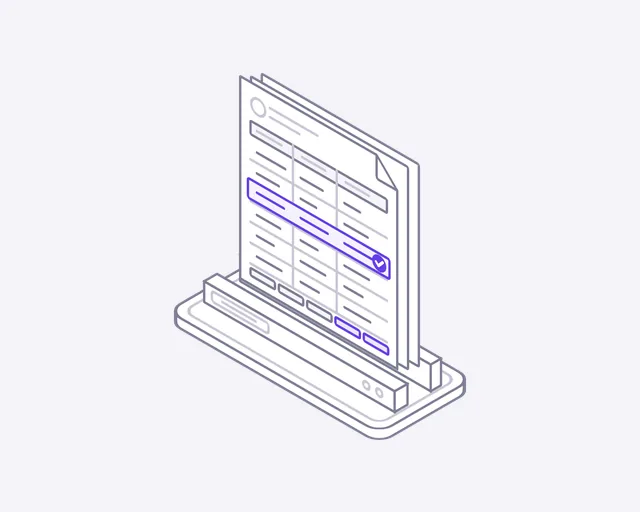
Data quality
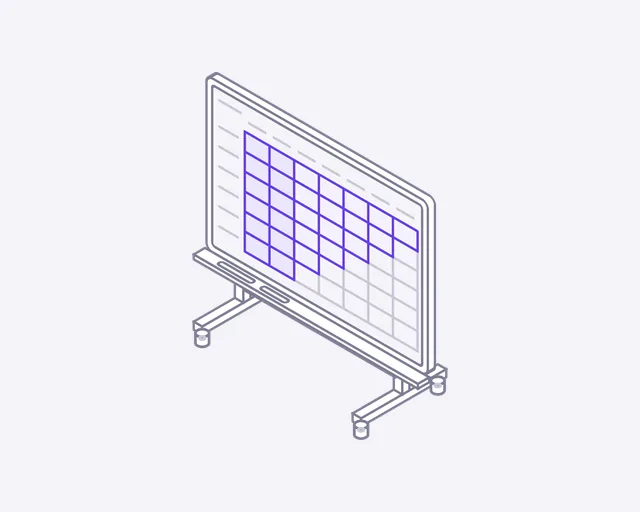
Cohort analysis
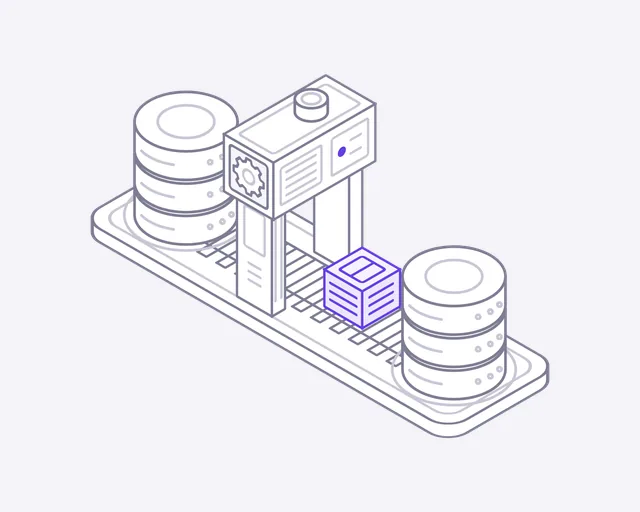
ETL pipeline
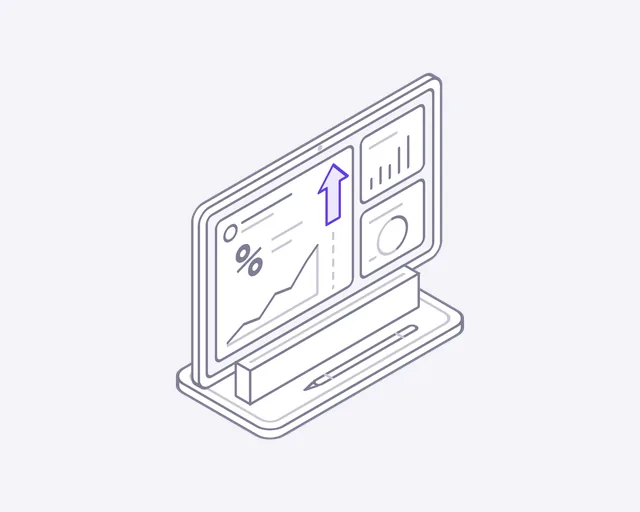
KPI card
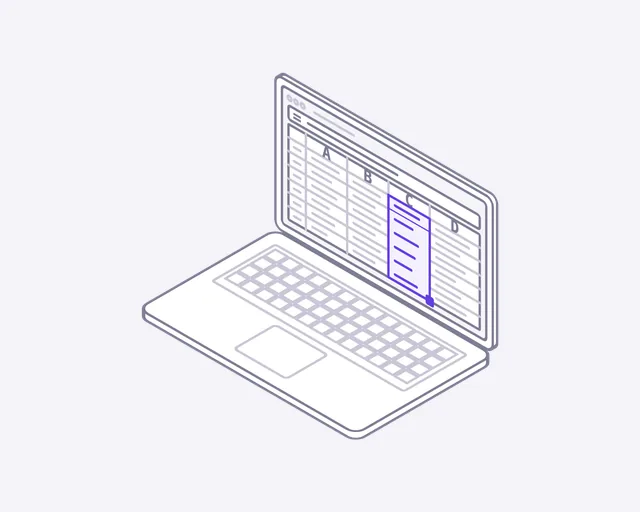
Spreadsheet
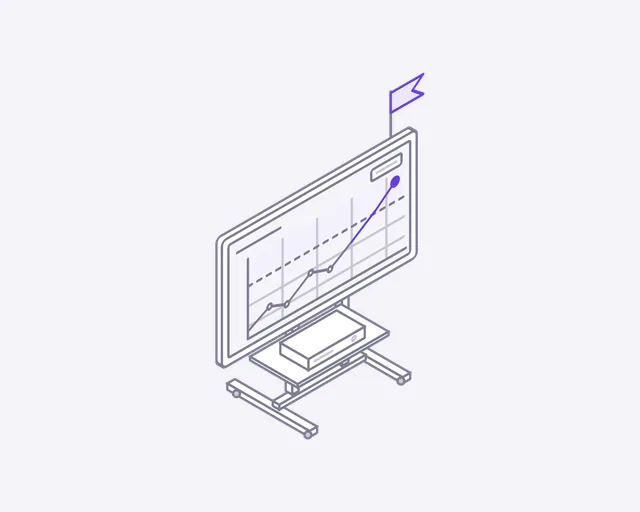
Threshold alert
Week 3
Two weeks later
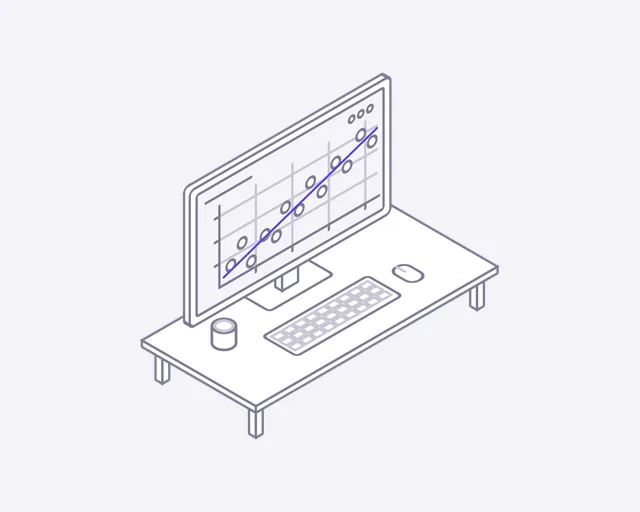
Scatter plot
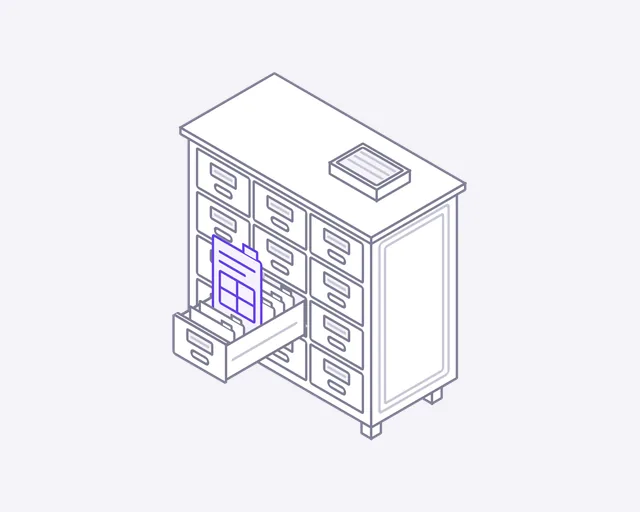
Data catalog
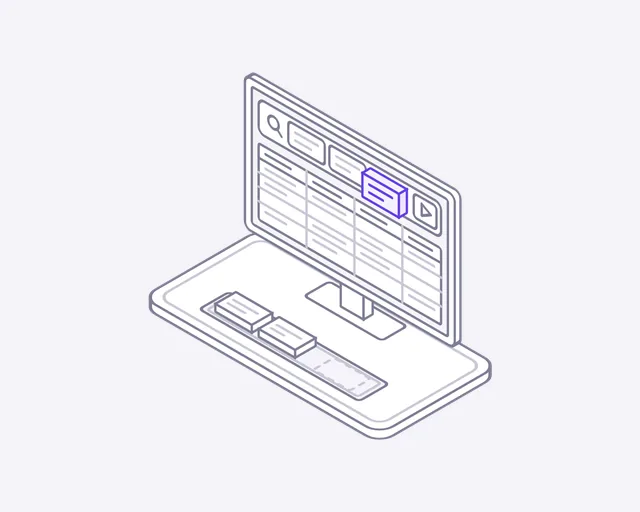
Query builder
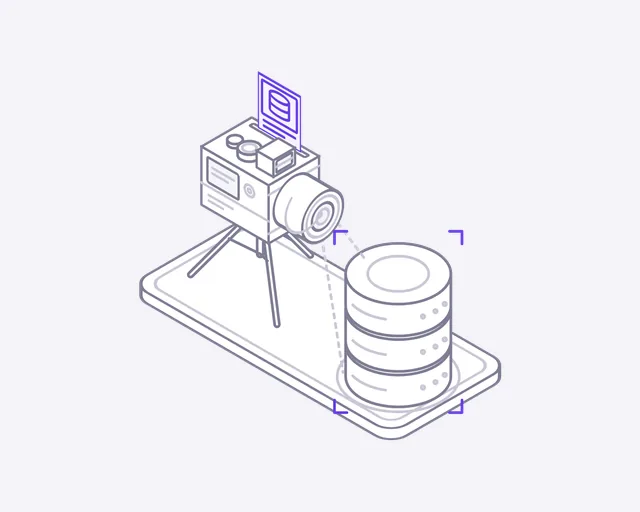
Snapshot
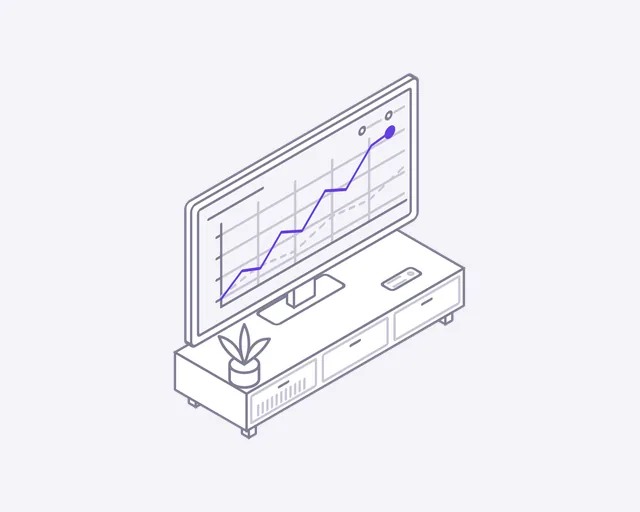
Line chart
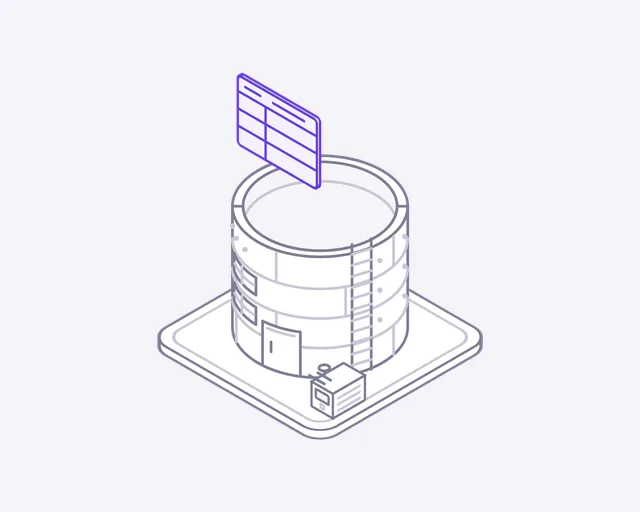
Data warehouse
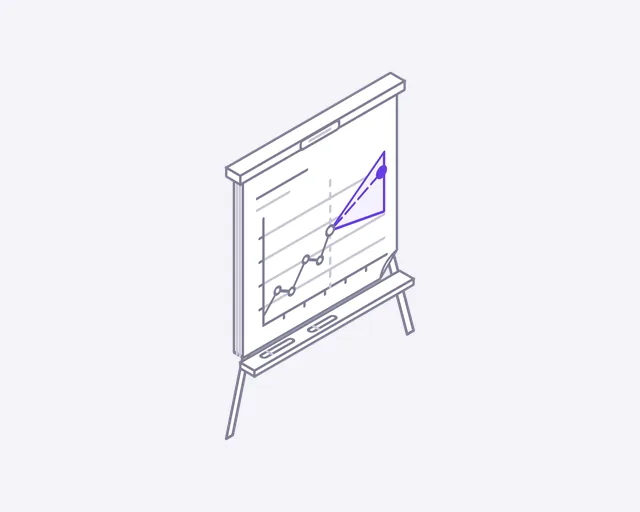
Forecast
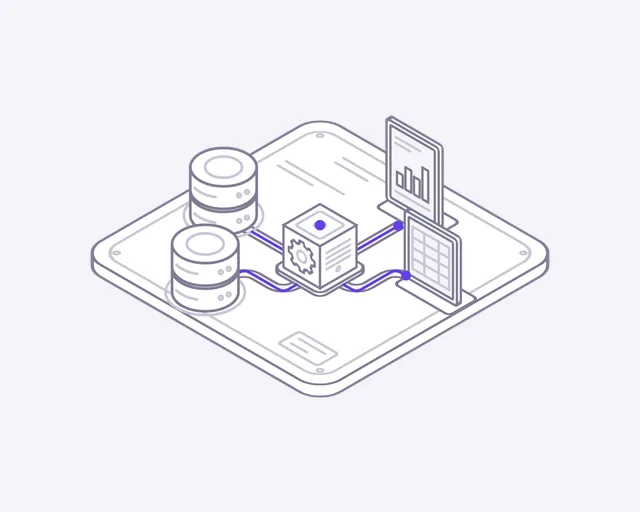
Data lineage
About this set
About the Data and analytics icons
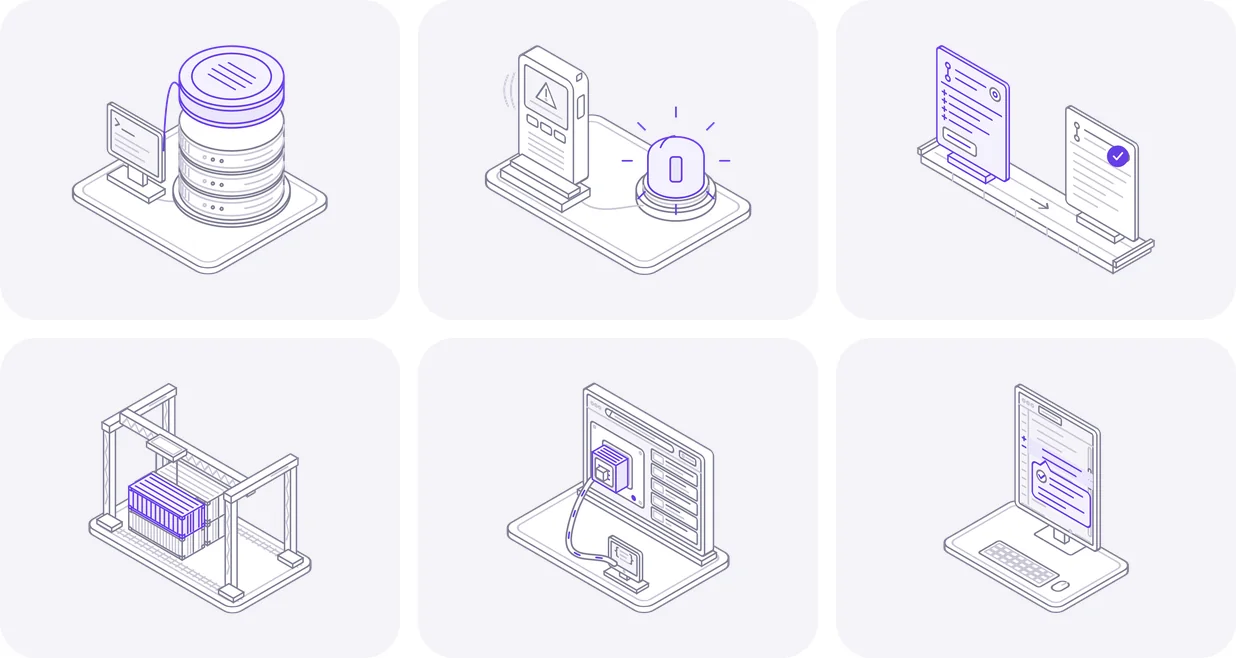
Data work is full of shapes that people nod at without understanding. These icons make each one move. Bars grow one after another. A dashed projection extends past the data. A block travels from the source through a transform gate into the target. The set covers charts, KPIs, forecasts, pipelines, warehouses and reports, so a product page can show what your tool does with the numbers.
Where they fit
Put Bar chart at the top of your reporting page, where the bars grow one after another. Use ETL pipeline on an integrations page, where a block moves from the source through the transform gate into the target. Show Forecast on a planning page, where a dashed projection extends past the data. Each one explains a step without a paragraph.
One look across the set
All 24 icons share the same 400 by 320 canvas, line weight and single accent colour. Charts, pipelines and quality checks all sit together on one page, and the family resemblance does the work of a style guide.
From the email to your page
- Open the email and download the ZIP. The svg folder holds the animated icons, and preview.html shows them all moving.
- For a looping icon, use the file as an image: an img tag with width 240 and height 192 keeps the 5:4 frame.
- For hover play, accent colour and dark mode, paste the SVG markup into your page instead of linking the file.
- Add data-play="hover" to the svg to play it only on hover, or data-cm-play="hover" on the card around it.
- Set --cm-accent to your brand colour, and add data-theme="dark" on dark backgrounds.
License
Free to use, with three limits
- Use them in websites, apps, products and client projects, free
- Credit is appreciated, not required
- Not allowed: selling or sharing them as icons, claiming them as yours, or using them in a logo
More industries

Building for Data and analytics?
We build Data and analytics products, not just their icons
DeveloperLook designs and builds the websites and software these icons are drawn for. See how we work in your market.
FAQ
Questions about the Data and analytics icons
 Saimul IslamFounder & CEO, DeveloperLook
Still have questions?
Send a message or book a call with the team.
Yes. Use them on any website, app, product or client project without paying. Attribution is welcome but you don't have to give it. You may not resell or redistribute them as icons, claim them as yours or use them in a logo. The license page spells out the terms.
There are 24 icons in the set, and they arrive over 3 weeks, 8 a week, with the first batch sent when your email is confirmed. They cover charts, data pipelines and forecasts. Every batch is ready to use on your site as soon as it arrives.
Put your email in the form on this page and confirm it. You'll get the first icons right away, then more each week until you have every one. The icons are sent per industry, so one address can follow one industry. Unsubscribing takes one click, any time.
You can. Open the SVG in Figma, Illustrator or another vector editor and change the shapes, sizes or colours. The animation is CSS inside the file, which means editors display the still pose. Use the untouched original when you want it moving on a web page. GIF and PNG copies come in each batch too.
No. Each icon is a small SVG with its motion in plain CSS, with no JavaScript and no fonts to load. Visitors who have reduced motion turned on see the still pose instead. A dashboard page already carries plenty of data, so icons that add almost no weight are welcome.
Saimul IslamFounder & CEO, DeveloperLookStill have questions?
Send a message or book a call with the team.
Free 30-min callGoogle Meet
Book a call
Book a free 30-minute call
In 30 minutes on Google Meet we walk you through how we would build it, how long it takes and what it costs. Then you get a written estimate.
Calendar not showing? Book on cal.com or send a brief.