KPI list and metric rules
A written definition for every metric, from net sales to contribution margin.

Ecommerce dashboard development that puts Shopify, Amazon, Walmart, and ad data in one view with margin by SKU. From $1,200.
1
Live view of every KPI
100%
Manual data pulls automated
Teams we have built for:














The Problem
It starts with your second sales channel. Each platform reports sales its own way, fees arrive later, and no screen shows what a product earned.
01 · Monday exports
Mondays go to exporting orders from every channel by hand.
Each channel flows through its official API into a database you own.
02 · Mixed rules
Fees and refunds land in different months across channels.
Refunds, fees, and time zones follow one set of rules you approve.
03 · Missing margin
By Wednesday you have revenue but no margin per product.
Product-level margin shows which SKUs actually pay.
04 · Wrong reorders
You reorder what looks busy and cut what quietly earns.
A past month gets reconciled against your records before anyone relies on it.
It's Monday. You export Shopify orders, download an Amazon business report, and paste Walmart sales into last week's spreadsheet. Ad spend sits in Meta and Google. Amazon fees land after the order does, and refunds get counted in a different month. By Wednesday you have a revenue number, but not the margin on your best seller. So you reorder the product that looks busy and cut the one that quietly makes money.
We start with the numbers you decide on: SKU margin, stock cover, return rate, and ad spend per order. Each channel flows through its official API into one database, with one set of rules for refunds, fees, and time zones. You check every figure against your records before launch. The result is one dashboard your team trusts, not another report nobody opens.
One set of definitions
Revenue, refunds, and margin follow rules you approve, matching your books.
Every channel in one place
Shopify, Amazon, Walmart, TikTok Shop, and ad accounts in one database you own.
Numbers checked before launch
A past month is reconciled against your records before anyone relies on it.
Our Dashboard Build Process
You approve the KPI list and margin rules before we build. Nothing goes live until the totals match your own records.
We review your channels, ad accounts, and spreadsheets, then list the KPIs you act on. You get a plan and a fixed price. If a free tool like Looker Studio covers your case, we'll tell you before we quote.
What's Included
Every plan covers metric rules, a data pipeline, dashboard views, a reconciled month, and support. Larger plans add channels, ad data, and alerts.
Compare Options
Analytics apps suit single-store sellers who want a standard view fast, and DIY BI suits teams with an analyst. We fit when neither matches your margin rules.
| Feature | DeveloperLookBest fit | Analytics app | DIY BI tool |
|---|---|---|---|
| Upfront cost | From $1,200, fixed scope | Low, then monthly fees | Free or low license fees |
| Time to first view | 2 to 10 weeks | Same day if supported | Weeks of analyst time |
| Margin rules | Yours, written and approved | The app's fixed formulas | Built by your analyst |
| Channels covered | Any channel with an API | Supported integrations only | Connectors or manual exports |
| Accuracy check | Past month reconciled first | You check it | You check it |
| Refresh speed | Daily to near real time | Set by the app's plan | Varies by license |
| Data ownership | Your database and code | Stored by the vendor | Your files and reports |
| Ongoing cost | Hosting, optional support | Monthly fee, often tiered | Licenses plus analyst hours |
Projects We've Built
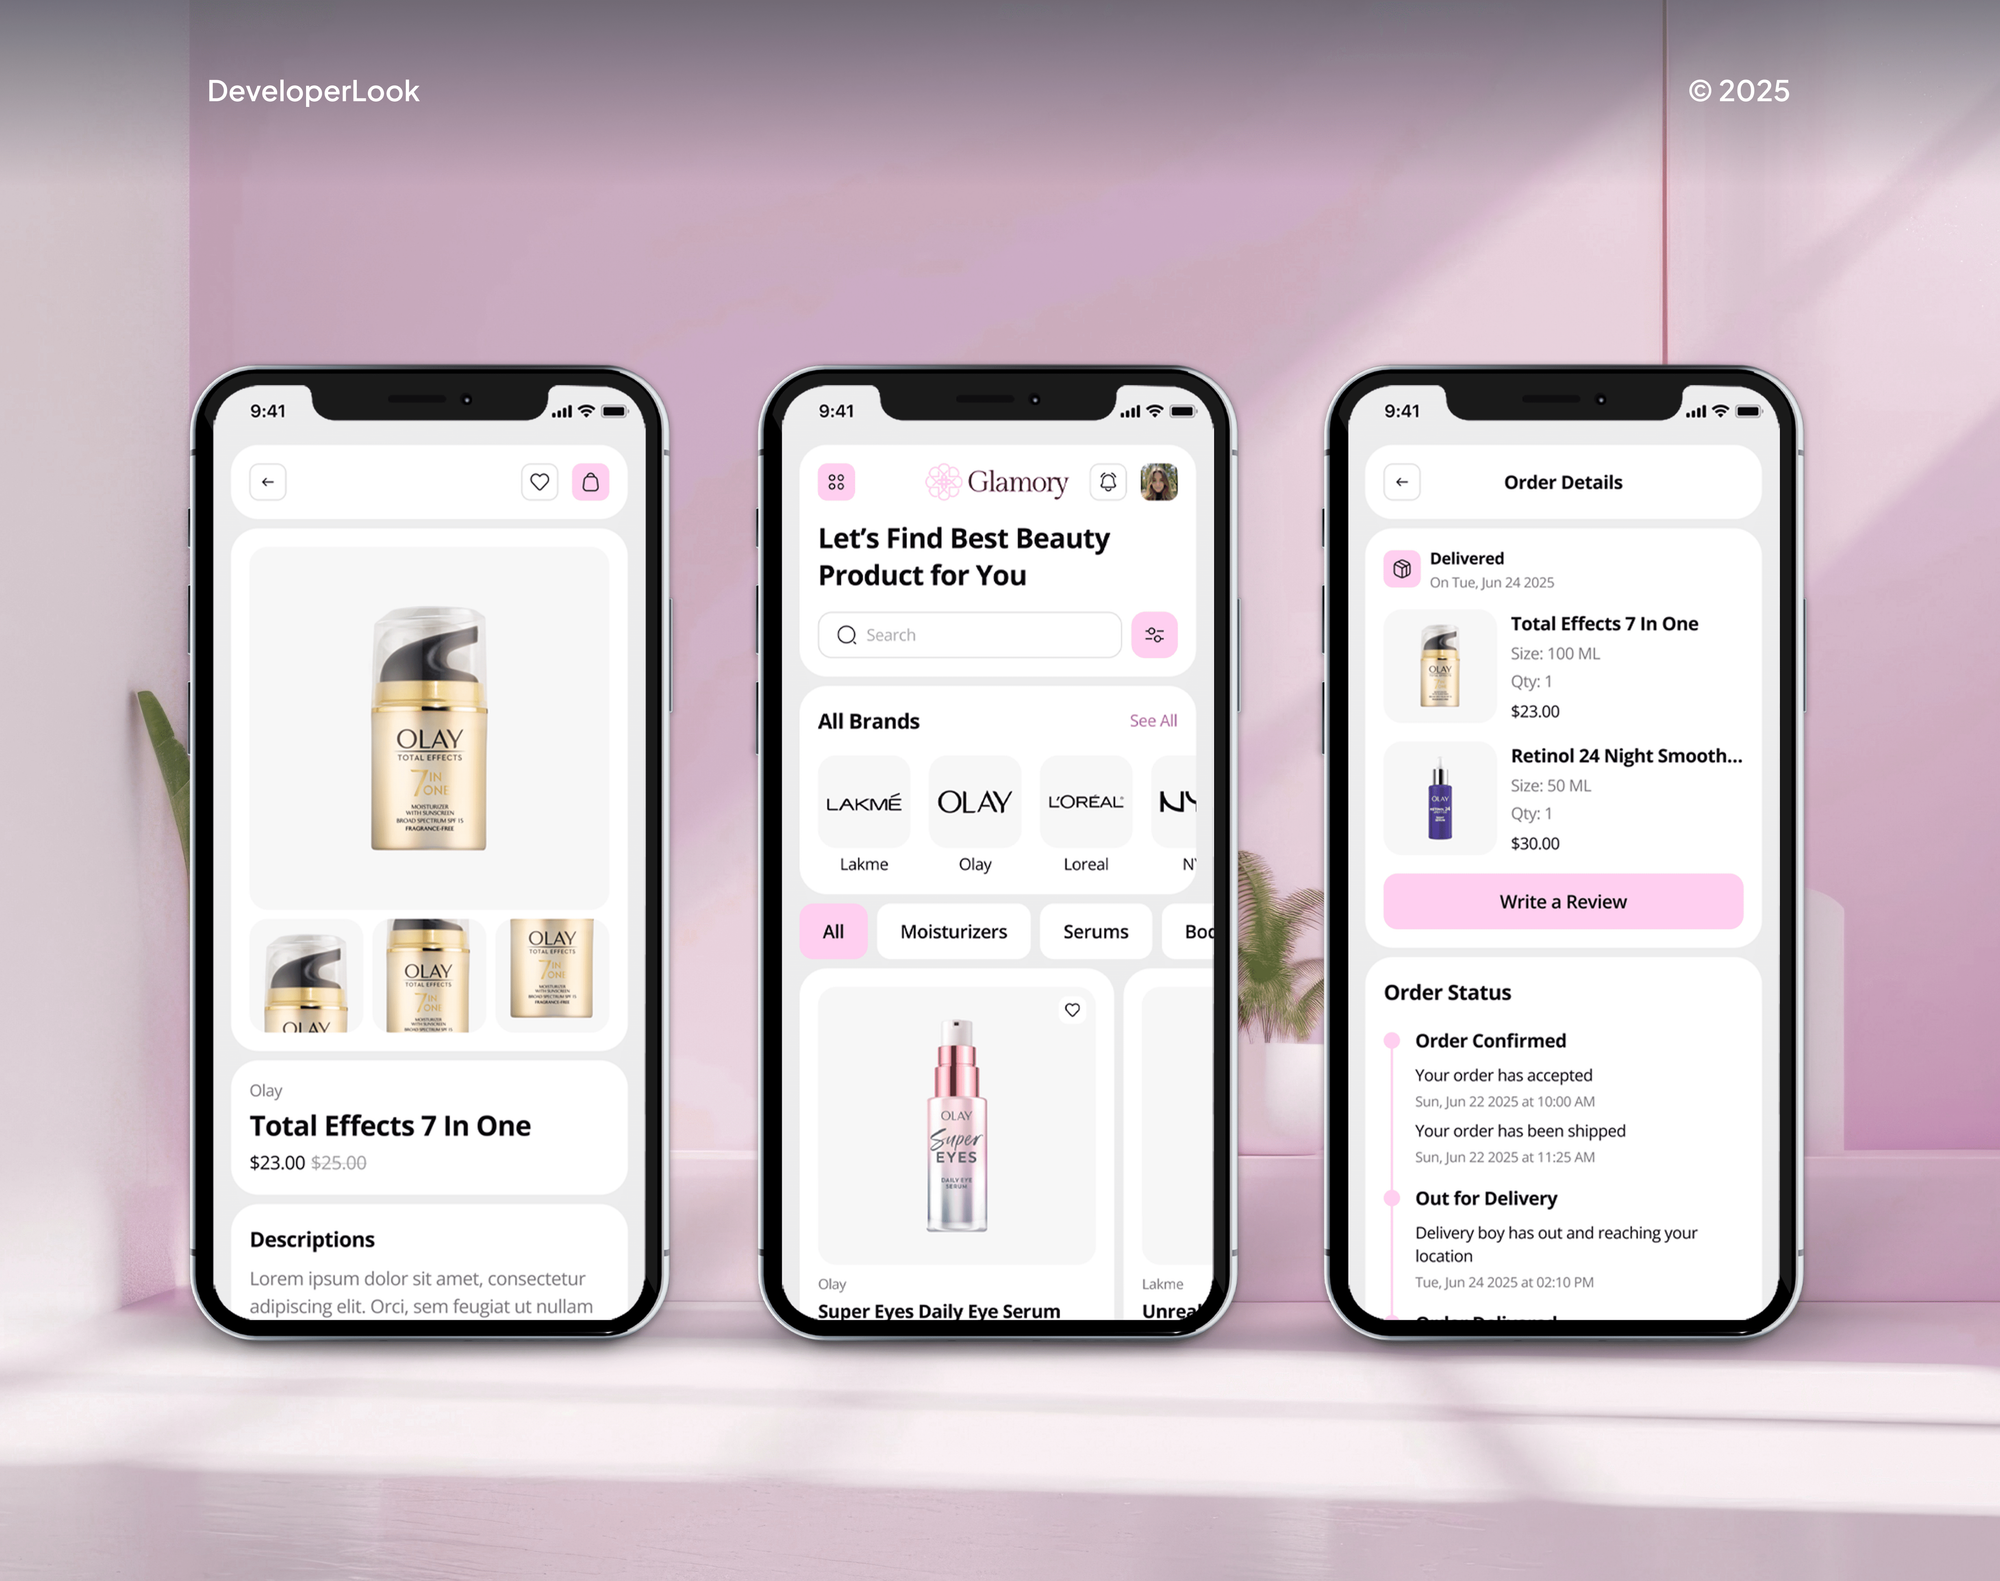
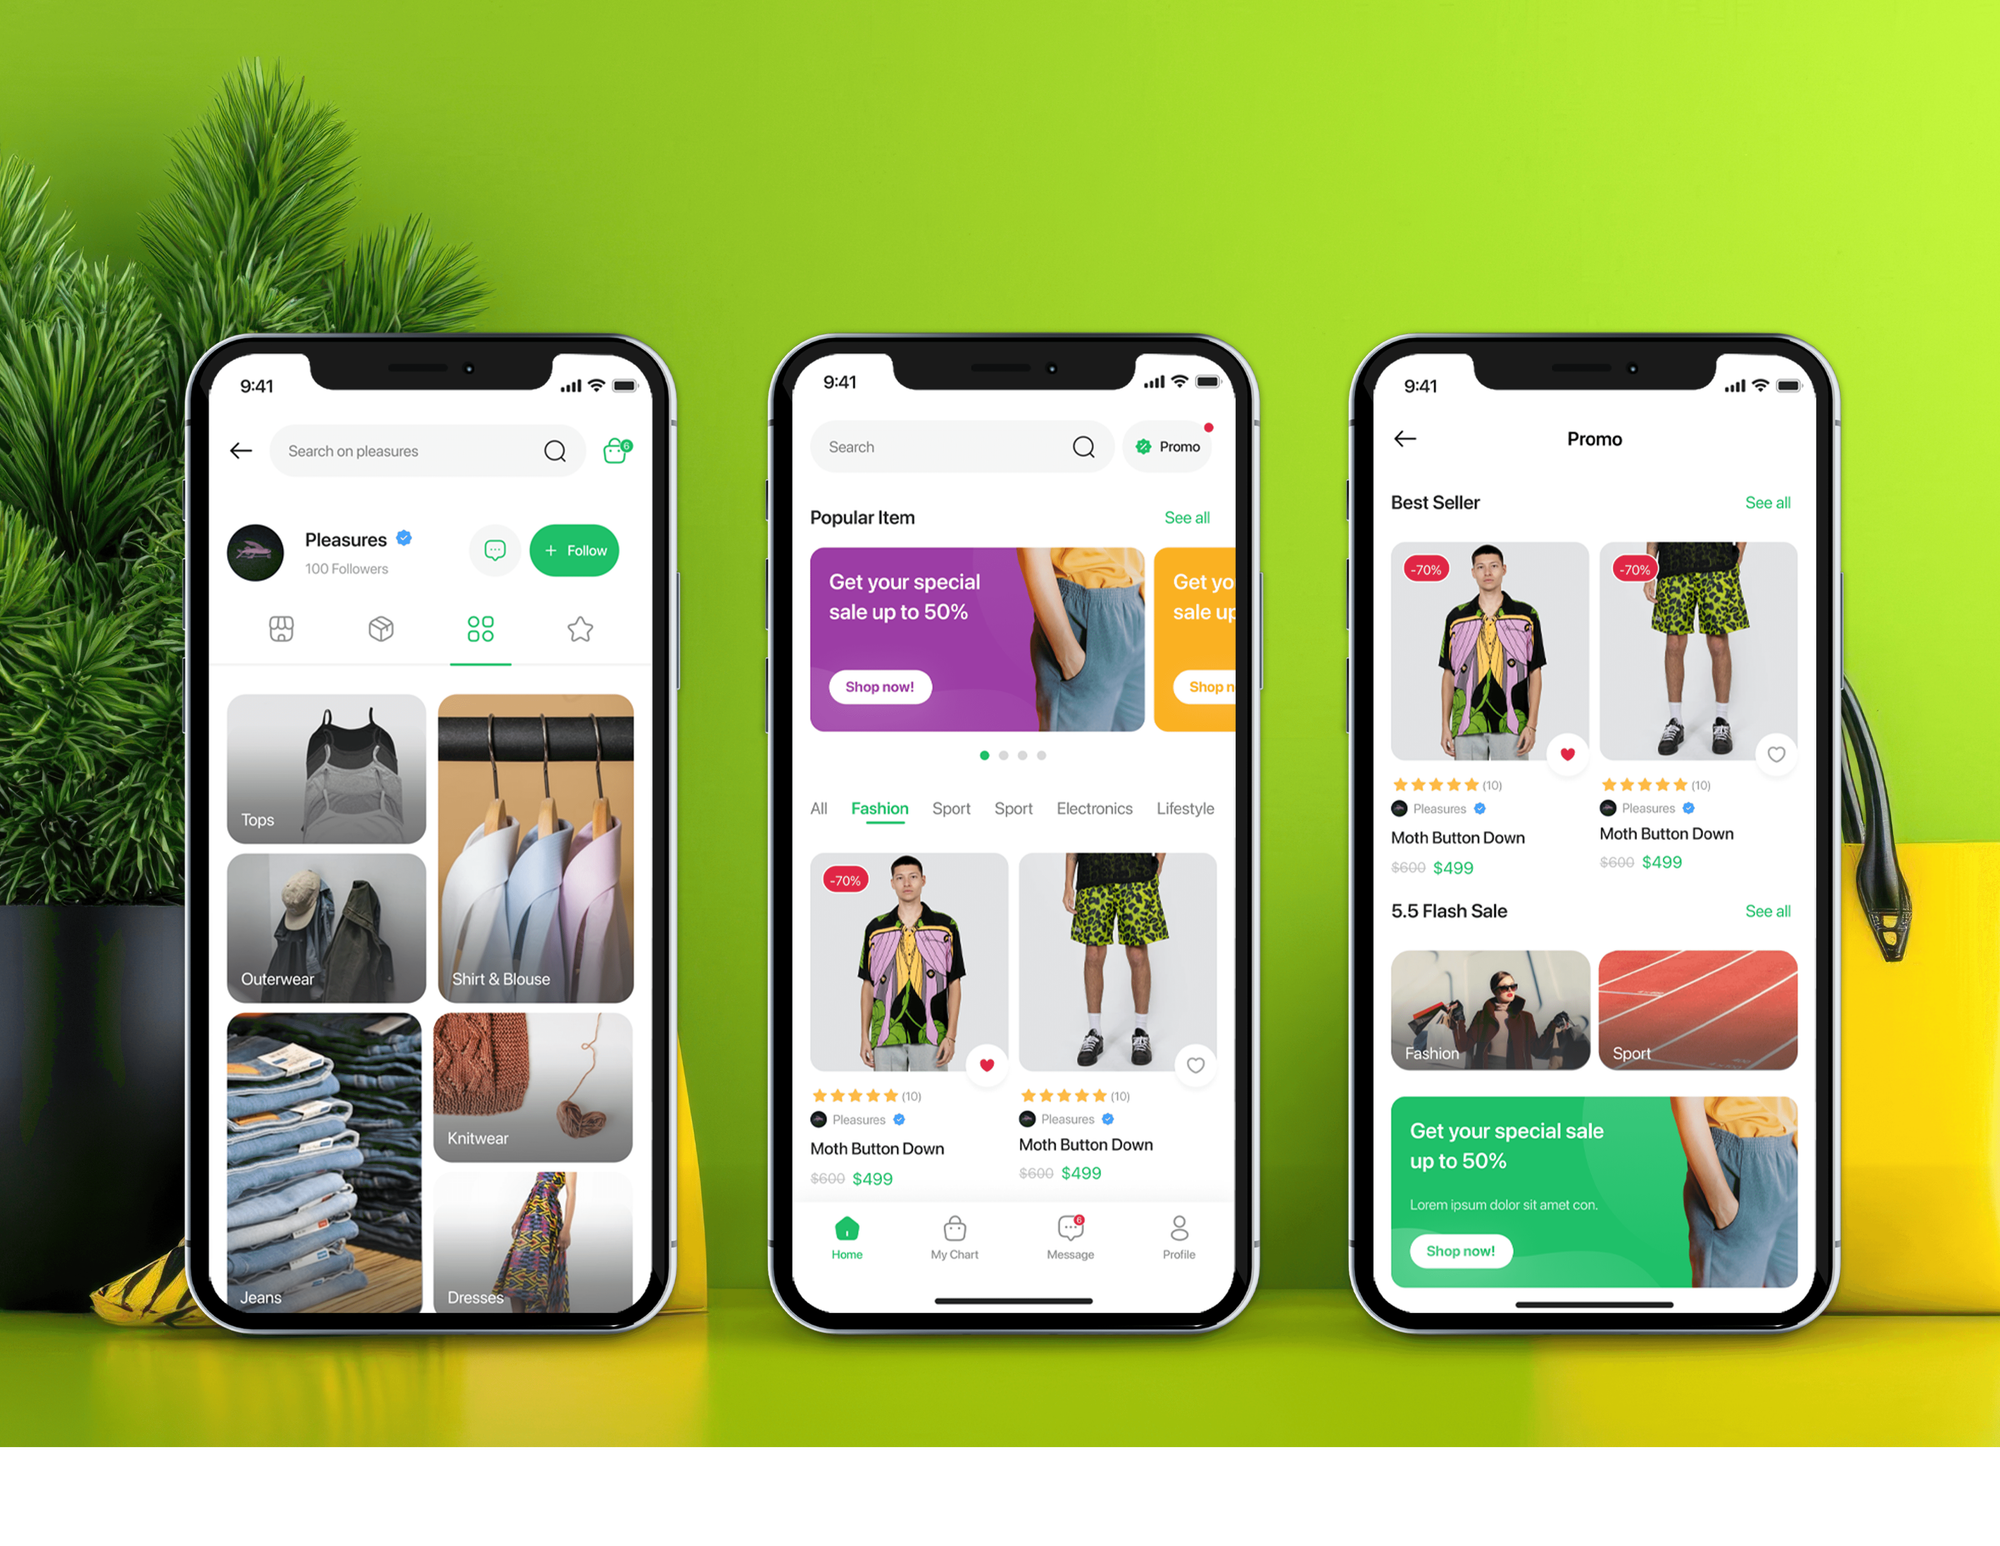
Ecommerce apps and stores we've designed and built, each with its own dashboard. The same care with data goes into every KPI dashboard we build.


What Our Clients Say
Feedback from ecommerce teams we have built stores, dashboards, and integrations for.
We had a different kind of problem. People were visiting the store, adding products to their carts, and then disappearing before they finished the order. We had tried a few apps and made changes here and there, but nothing really seemed to solve the bigger issue. The team went through the shopping experience with us and pointed out things we hadn't really noticed ourselves. They cleaned up the cart and checkout flow, made the mobile experience much smoother, and helped us make the store feel easier to shop. I’m not going to pretend we fixed everything overnight, but it finally feels like the store is helping the sale instead of getting in the way of it.
The mobile experience is probably my favourite part of the new site. We had spent a lot of time making sure the desktop version looked right, and the team kept pushing us to think about how everything would actually feel on a phone too. They were right. The navigation is clean, the interactions feel natural, and everything we’ve tested so far works exactly as it should. They also went through the links, forms, integrations, and other details more than once before launch, which I really appreciated. And even after going live, we could still reach out when something came up. The whole process felt friendly, organised, and surprisingly straightforward.
We had a pretty specific idea of what we wanted our website to become, but I wasn’t sure how easily we could explain all of it to a development team. There were quite a few moving parts, and we were working toward a deadline, so I expected a few things to get lost along the way. That never really happened. They understood what we were trying to achieve, kept us updated throughout the process, and got everything ready within the agreed timeline. The final site feels much easier to navigate, works beautifully on mobile, and is noticeably smoother for our customers. It was a huge relief seeing the original idea actually turn into the website we had in mind.
1,000+
Projects shipped
10+
Years of experience
Top 3%
Upwork Top Rated Plus
5 stars
Average review score
Work Culture
A dashboard only helps if every number on it is right, so accuracy comes before charts. These habits go into every build.
Amazon's Finances API may omit orders from the last 48 hours, per Amazon's docs. We show estimated fees until actual ones arrive, then swap them in.
Shopify reports profit only for items with a cost recorded when they sold, per its help center. We load your cost history first, so past margins aren't blank.
Amazon lists products by ASIN, and Walmart uses its own item IDs. We map every listing back to your SKU, so one product doesn't show up as three.
Net sales and margin mean different things in each tool. You approve written rules for every metric before we chart it, so meetings debate decisions, not numbers.
We rebuild a past month from raw data and compare it with your reports and books. You approve the totals before your team sees the dashboard.
The database, code, and dashboards live in your own accounts, with logins and documentation handed over. Switching developers or tools later doesn't mean starting over.
Overview
DeveloperLook builds a custom ecommerce dashboard that pulls Shopify, Amazon, Walmart, and ad data into one live view. You get KPIs, contribution margin by SKU after fees and refunds, stock cover, and conversion, with alerts when a number moves. Projects start at $1,200, most go live in 2 to 10 weeks, and the code and data stay yours.
DEVELOPERLOOK
Project facts · Ecommerce Dashboard Development
Reviewed 28 Sep 2026 by Saimul Islam
Good fit
Sellers on Shopify plus marketplaces
You sell on Shopify, Amazon, and Walmart, and you rebuild the same ecommerce metrics dashboard in a spreadsheet every Monday.
Owners who need profit, not revenue
Your reports show strong sales, but nobody can say which SKUs still make money after fees, shipping, and returns.
Operations and finance leads
You plan stock and cash, and you need days of cover, return rates, and SKU margins in one ecommerce reporting dashboard.
Teams outgrowing an analytics app
Your analytics app covers Shopify but not Walmart or TikTok Shop, and its margin formula doesn't match your accountant's.
Agencies reporting to ecommerce clients
Your agency reports to ecommerce clients monthly and wants a branded dashboard for each, built under your name.
Not a fit
Standard sales charts
You run one store and need only standard sales charts. Shopify's own analytics or a free Looker Studio report costs less than our $1,200 start.
Scheduled email reports
You want reports emailed on a schedule, not a screen to check. Our Ecommerce Reporting Software page covers that.
Operations across channels
You need orders, stock, and listings managed across channels, not just reported. Our Multichannel Ecommerce Software service builds that system.
Stock counts drifting
Your stock counts drift between channels. Our Multichannel Inventory Sync service fixes that first, because a dashboard can't fix bad stock data.
Not sure we're the right fit?
Send a two-line brief. We'll tell you honestly whether we're the right team.
Pricing
These are starting points in USD. Your final price depends on channel count, history, and refresh speed, and you get a fixed proposal after a free data review.
For one Shopify, WooCommerce, or BigCommerce store that wants KPIs and margins in one view.
$1,200one-time, USD
For sellers on up to 4 channels who need margin after fees and ads.
$3,300one-time, USD
For high-volume or multi-brand sellers that need full history and finance data.
$6,600one-time, USD
For Agencies
You own the client relationship. We supply the data work behind it: connectors, margin rules, dashboard views, and a reconciled launch. Your clients see your brand, and you get documentation to support them.
White label: your client only ever sees your brand
Send the client's channels, ad accounts, and the reports they read today.
You get the KPI plan, a timeline, and one fixed price.
We build, reconcile a past month, and document it under your brand.
We work under your brand, so every client report stays yours.
A fixed price and KPI rules your client approves before the build.
Each dashboard is checked against the client's own reports and books.
Bring us in for one client dashboard or a reporting product.
The Right Technology for Your Project
We pull each channel through its official API into a database you own, then build views in React or Power BI.
 Shopify
 Amazon
 Walmart
 TikTok
 WooCommerce
 BigCommerce
 Google Analytics (GA4)
 Meta
Meta QuickBooks
 Xero
Xero Node.js
 Python
 PostgreSQL
 AWS
AWS Docker
 React
React Next.js
 Power BI
 Google Sheets
 Slack
SlackFAQ
Straight answers on KPIs, margins, cost, timelines, refresh rates, and BI tools.
 Saimul IslamFounder & CEO, DeveloperLook
Still have questions?
Send a message or book a call with the team.
A useful dashboard shows the numbers you act on weekly: net sales, orders, conversion rate, average order value, and margin per product. Most sellers add stock cover, return rate, and ad spend per order. We agree each definition first, so the screen stays readable in minutes.
You see margin by SKU by joining each order line with its product cost, channel fees, shipping, discounts, and refunds in one database. Fees come from each channel's data, such as Amazon's Finances API, and costs from Shopify or your ERP. You then see margin per SKU and per channel.
A single-store dashboard starts at $1,200, with GA4, daily refresh, and SKU margins included. Up to 4 sales channels with ad spend and stock views costs $3,300. A data warehouse build with up to 10 sources starts at $6,600. Every quote is fixed after a free data review.
A single-store dashboard takes 2 to 3 weeks from data review to launch. Multichannel builds with ad data take 4 to 6 weeks, and data warehouse builds take 7 to 10 weeks. The slowest step is often access, since an admin must approve each channel's API connection.
A BI tool fits when an analyst can maintain it and its connectors cover your channels. A custom dashboard fits when margin rules span several channels or it must live inside your own admin. We'll tell you when Power BI or Looker Studio is enough, and we also build on Power BI.
Yes, one dashboard can combine all four, since each platform offers an API. We load orders and fees from every channel and daily spend from Meta and Google Ads into one database. Ad spend is matched by date and channel, and by product where the ad platform reports it.
Yes, inventory, returns, and conversion can sit beside sales on one dashboard. Stock comes from your store, 3PL, or ERP, returns from refunds and your returns app, and conversion from GA4 sessions. Return rate by SKU sits next to sales, so a fast seller with heavy returns stands out.
Dashboard data can refresh daily, hourly, or in near real time, depending on the plan and source. Order webhooks update sales within minutes, while ad spend and fees sync daily. Google says GA4 data can take 24 to 48 hours to process and may change meanwhile, so we flag those days.
Every build includes 30 to 90 days of support, depending on the plan. That covers sync fixes, small metric changes, and channel API updates, which come more often than most sellers expect. After that, we can quote ongoing support, or your team runs it with our documentation.
You own everything from custom dashboard development: the code, database, and dashboards sit in your own cloud and tool accounts. We hand over logins, documentation, and a recorded walkthrough at launch. If you change developers or tools later, your history and metric rules come with you.
Saimul IslamFounder & CEO, DeveloperLookStill have questions?
Send a message or book a call with the team.
30-min strategy callGoogle Meet
Book a call
Pick a 30-minute slot that works for you. We meet on Google Meet to align on goals, scope, and the right next step.
