
Utility and meter data import
Interval data from utility portals, Green Button files, and submeters, pulled on a schedule and checked for gaps.

For facility and plant teams: one system that pulls utility, submeter, and building data together, flags waste, and writes the reports you owe. From $1,450.
100%
Sites on one dashboard
3X
Faster monthly energy reports
How your project runs
01 · FreeTeams we have built for:













The Problem
It shows when the bills land. Usage sits in PDFs and utility portals, building systems keep their own logs, and nobody can say which site or schedule drove the cost.
PDF bills
Utility bills arrive as PDFs and get retyped into spreadsheets.
PDF bills
Bill and interval data import on a schedule, matched to each site and meter.
Silent waste
Weekend and after-hours loads go unnoticed until the bill arrives.
Silent waste
Schedule alarms flag loads running outside operating hours the next morning.
Weather excuses
Nobody can say if a cost jump was weather or waste.
Weather excuses
Baselines adjust for degree days and production, so real changes stand out.
Report crunch
Sustainability and ISO 50001 reports take days of copy and paste.
Report crunch
Reports build from the same data, with energy performance indicators you define.
The utility bills for your sites arrive as PDFs in several inboxes. Someone types the kWh and demand charges into a spreadsheet that breaks every time a meter gets swapped. The chillers ran all weekend at one building, but nobody saw it until the bill came. Finance asks why another site's cost jumped, and the only answer is a guess about the weather. Then your ISO 50001 or sustainability report needs a baseline that nobody trusts.
We start with your meters: which ones exist, what they measure, and where their data already goes. Then we pull utility interval data, submeter readings, and building system points into one model of your sites. Schedules and baselines watch every load and send alerts to the person who can fix it. Waste shows up the morning after, not on next month's bill.
Every meter in one model
Utility meters, submeters, and building system points share one hierarchy of sites, buildings, and loads.
Alarms on loads left running
Rules compare each load to its schedule and baseline, then alert the person responsible for it.
Baselines that account for weather
Degree days and production volume normalize your usage, so savings hold up when finance reviews them.
Our Energy Management Software Development Process
You walk us through your meters and sites before any scope, then approve the data model and each screen. Totals get checked against your utility bills before the alerts go live.
We list every meter, submeter, and building system with your facility lead and check what data each one already exports. You get a meter map, a plan for each data source, and a written scope.
What's Included
Your build covers utility and meter data, building and plant connections, dashboards, alarms, baselines, and reports. It runs on cloud accounts you own and keeps every raw reading.
Compare Options
An energy SaaS suits sites on standard meters and utilities, and spreadsheets work for a few bills a month. Here is where each option fits your sites and reports.
| Feature | DeveloperLookBest fit | Energy SaaS | Spreadsheets |
|---|---|---|---|
| Fit to your sites | Built around your meters | Standard site templates | Whatever the sheet holds |
| Meter and BMS data | Utility, submeters, BACnet, and Modbus | Supported devices and utilities | Typed in from bills |
| Alarms | Rules you set per load | Preset alarm types | |
| Baselines | Weather and production normalized | Weather normalization included | Manual and inconsistent |
| Time to start | 7 to 18 weeks | Days to a few weeks | Same day |
| Upfront cost | Fixed price per phase | Low setup fee | Close to nothing |
| Ongoing fees | Hosting only, no license | Fees per site or meter | Staff time every month |
| Data ownership | Your code and data | Vendor platform, exports vary | Yours, in loose files |
Projects We've Built
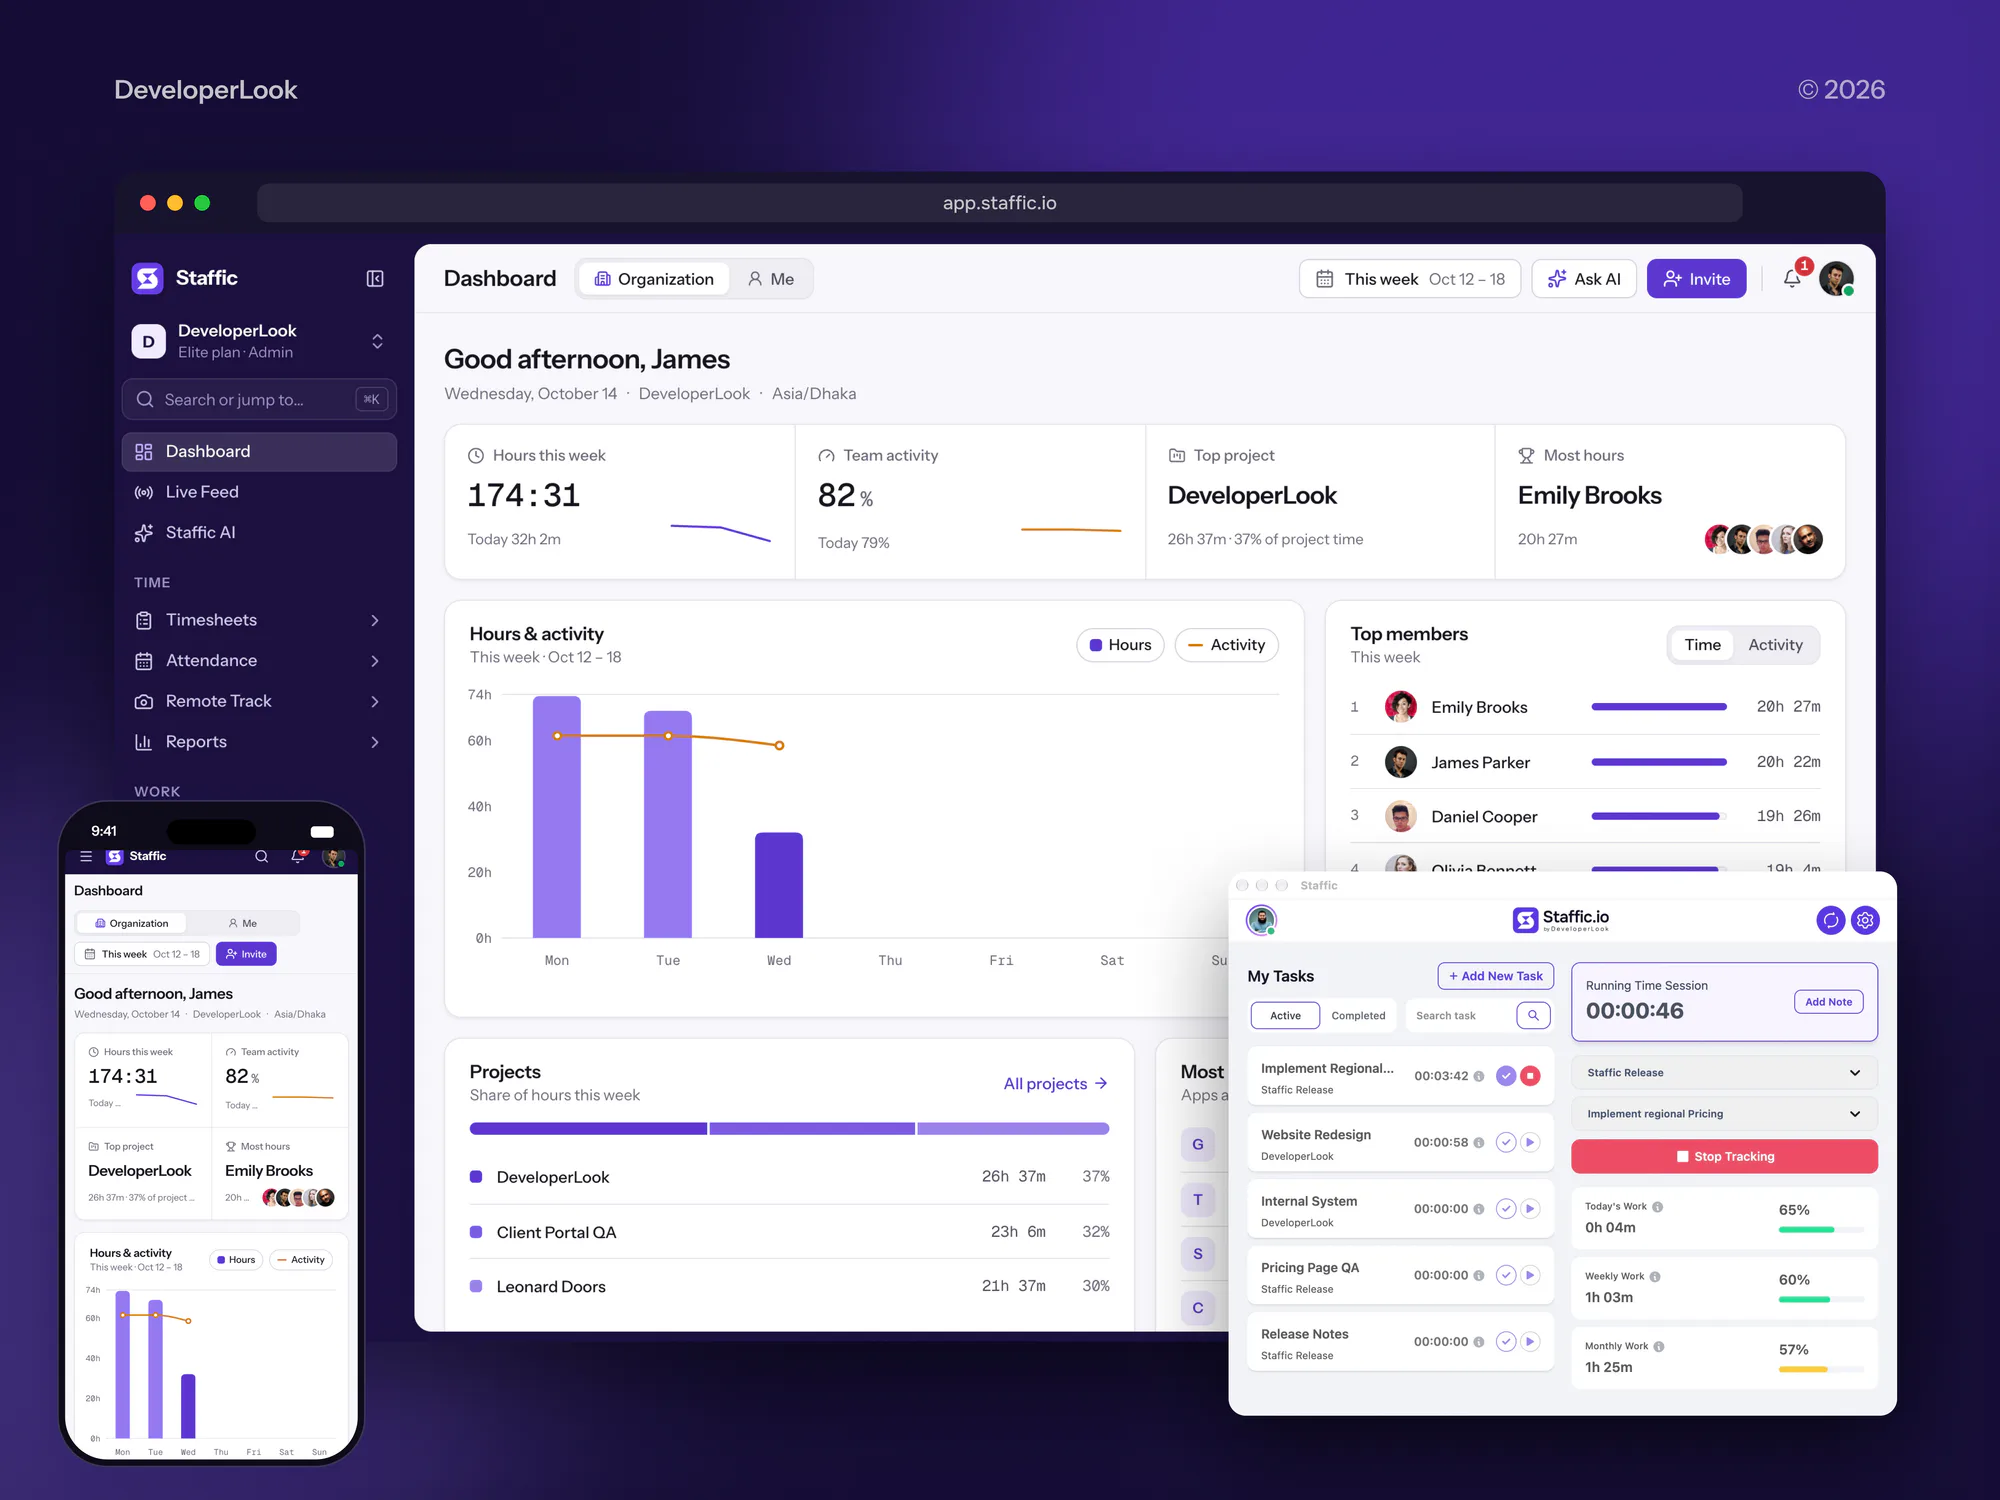
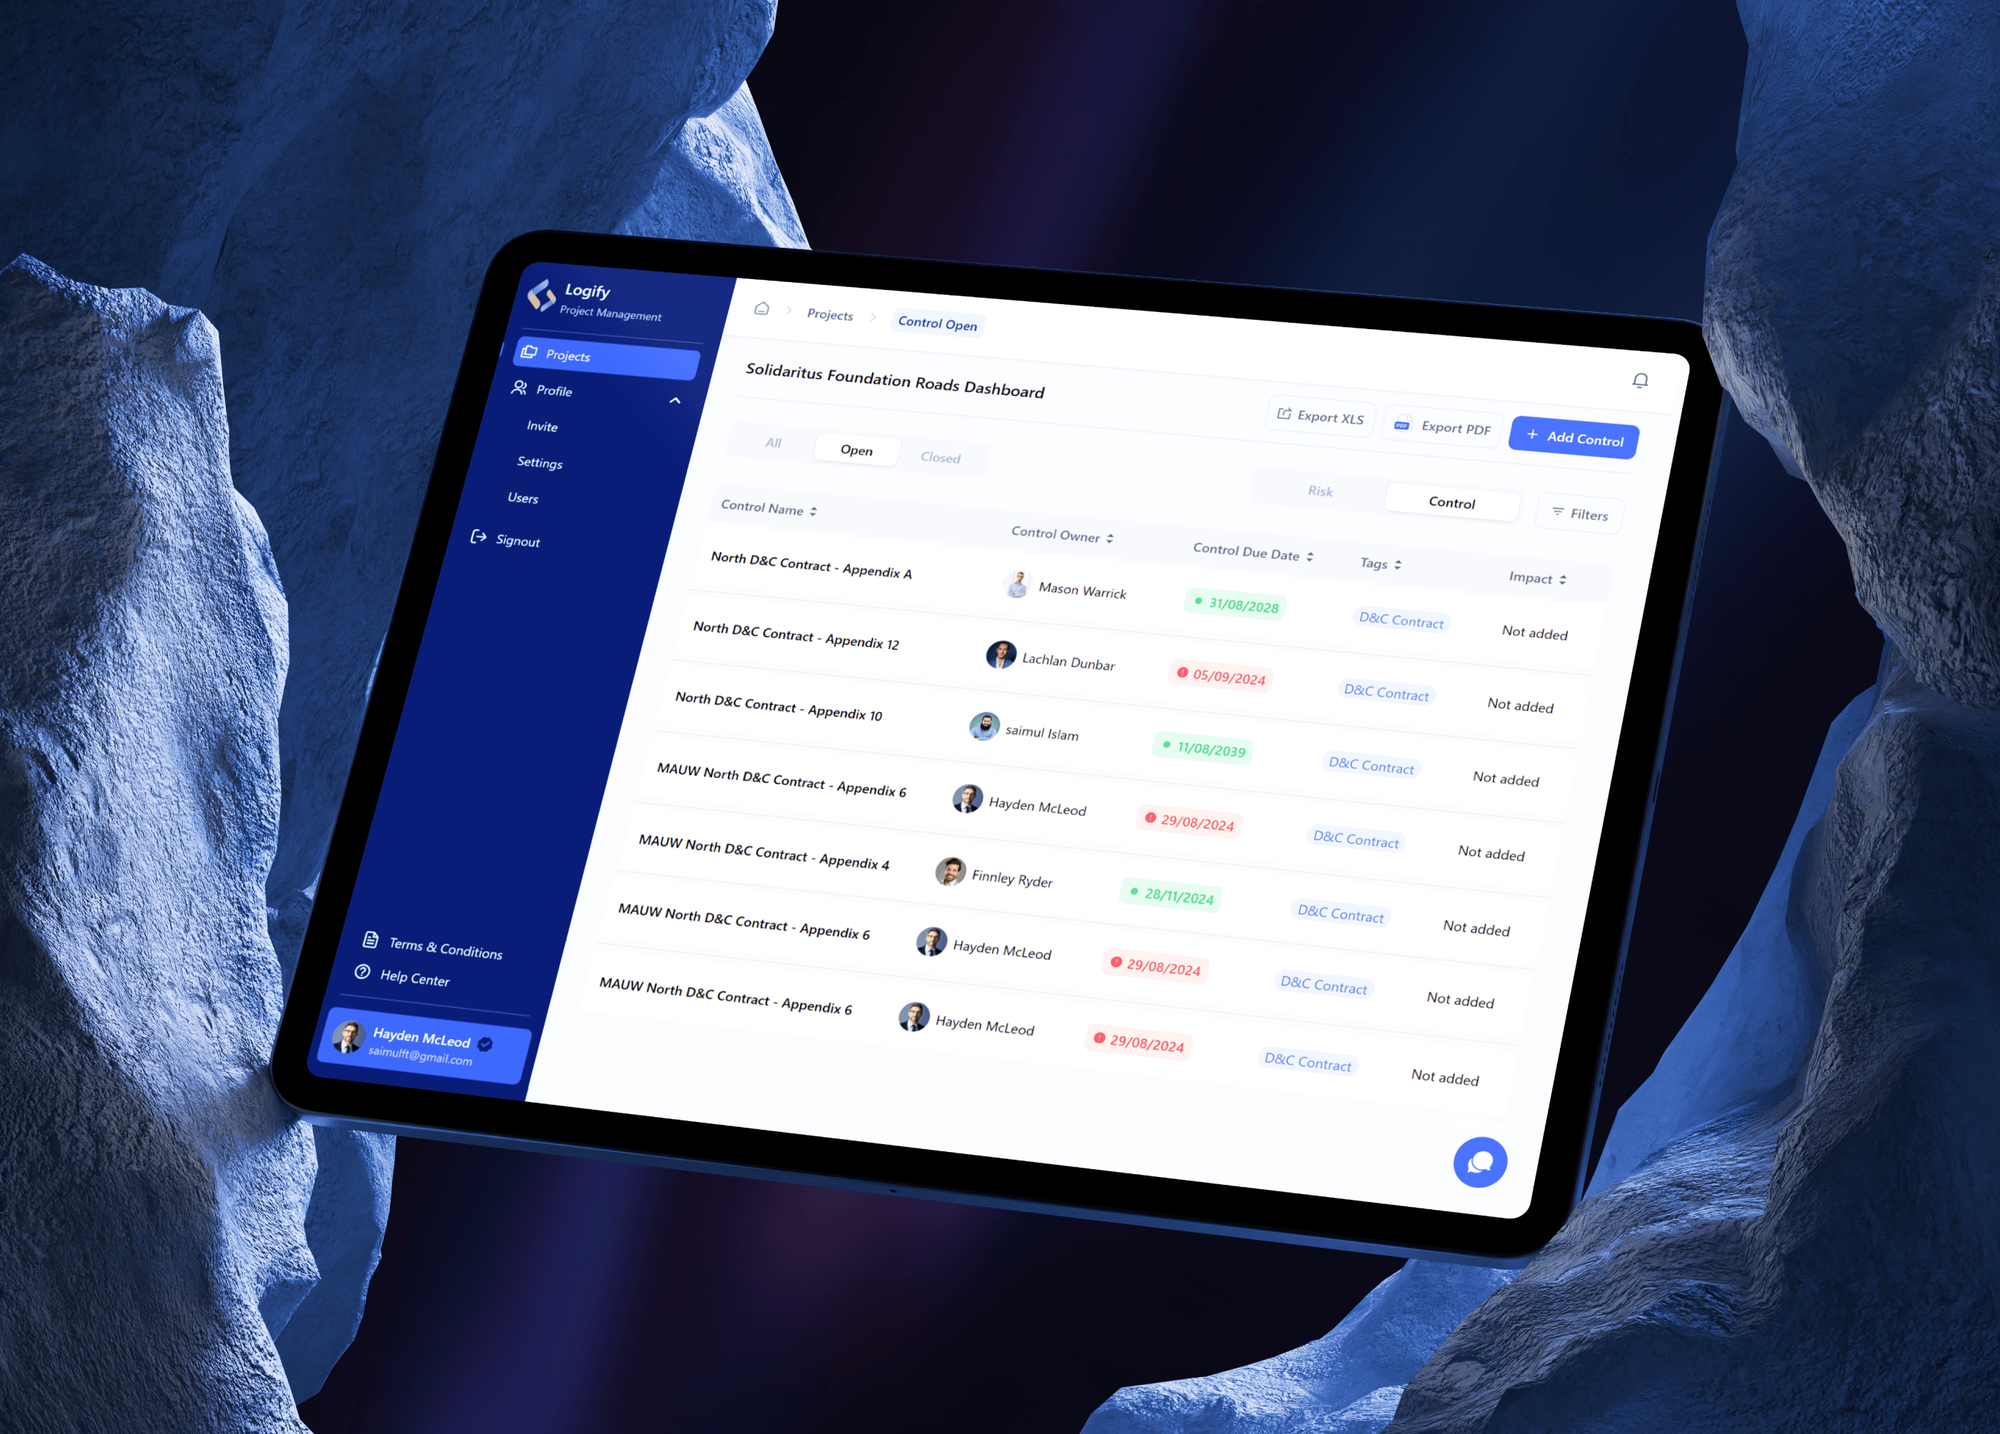
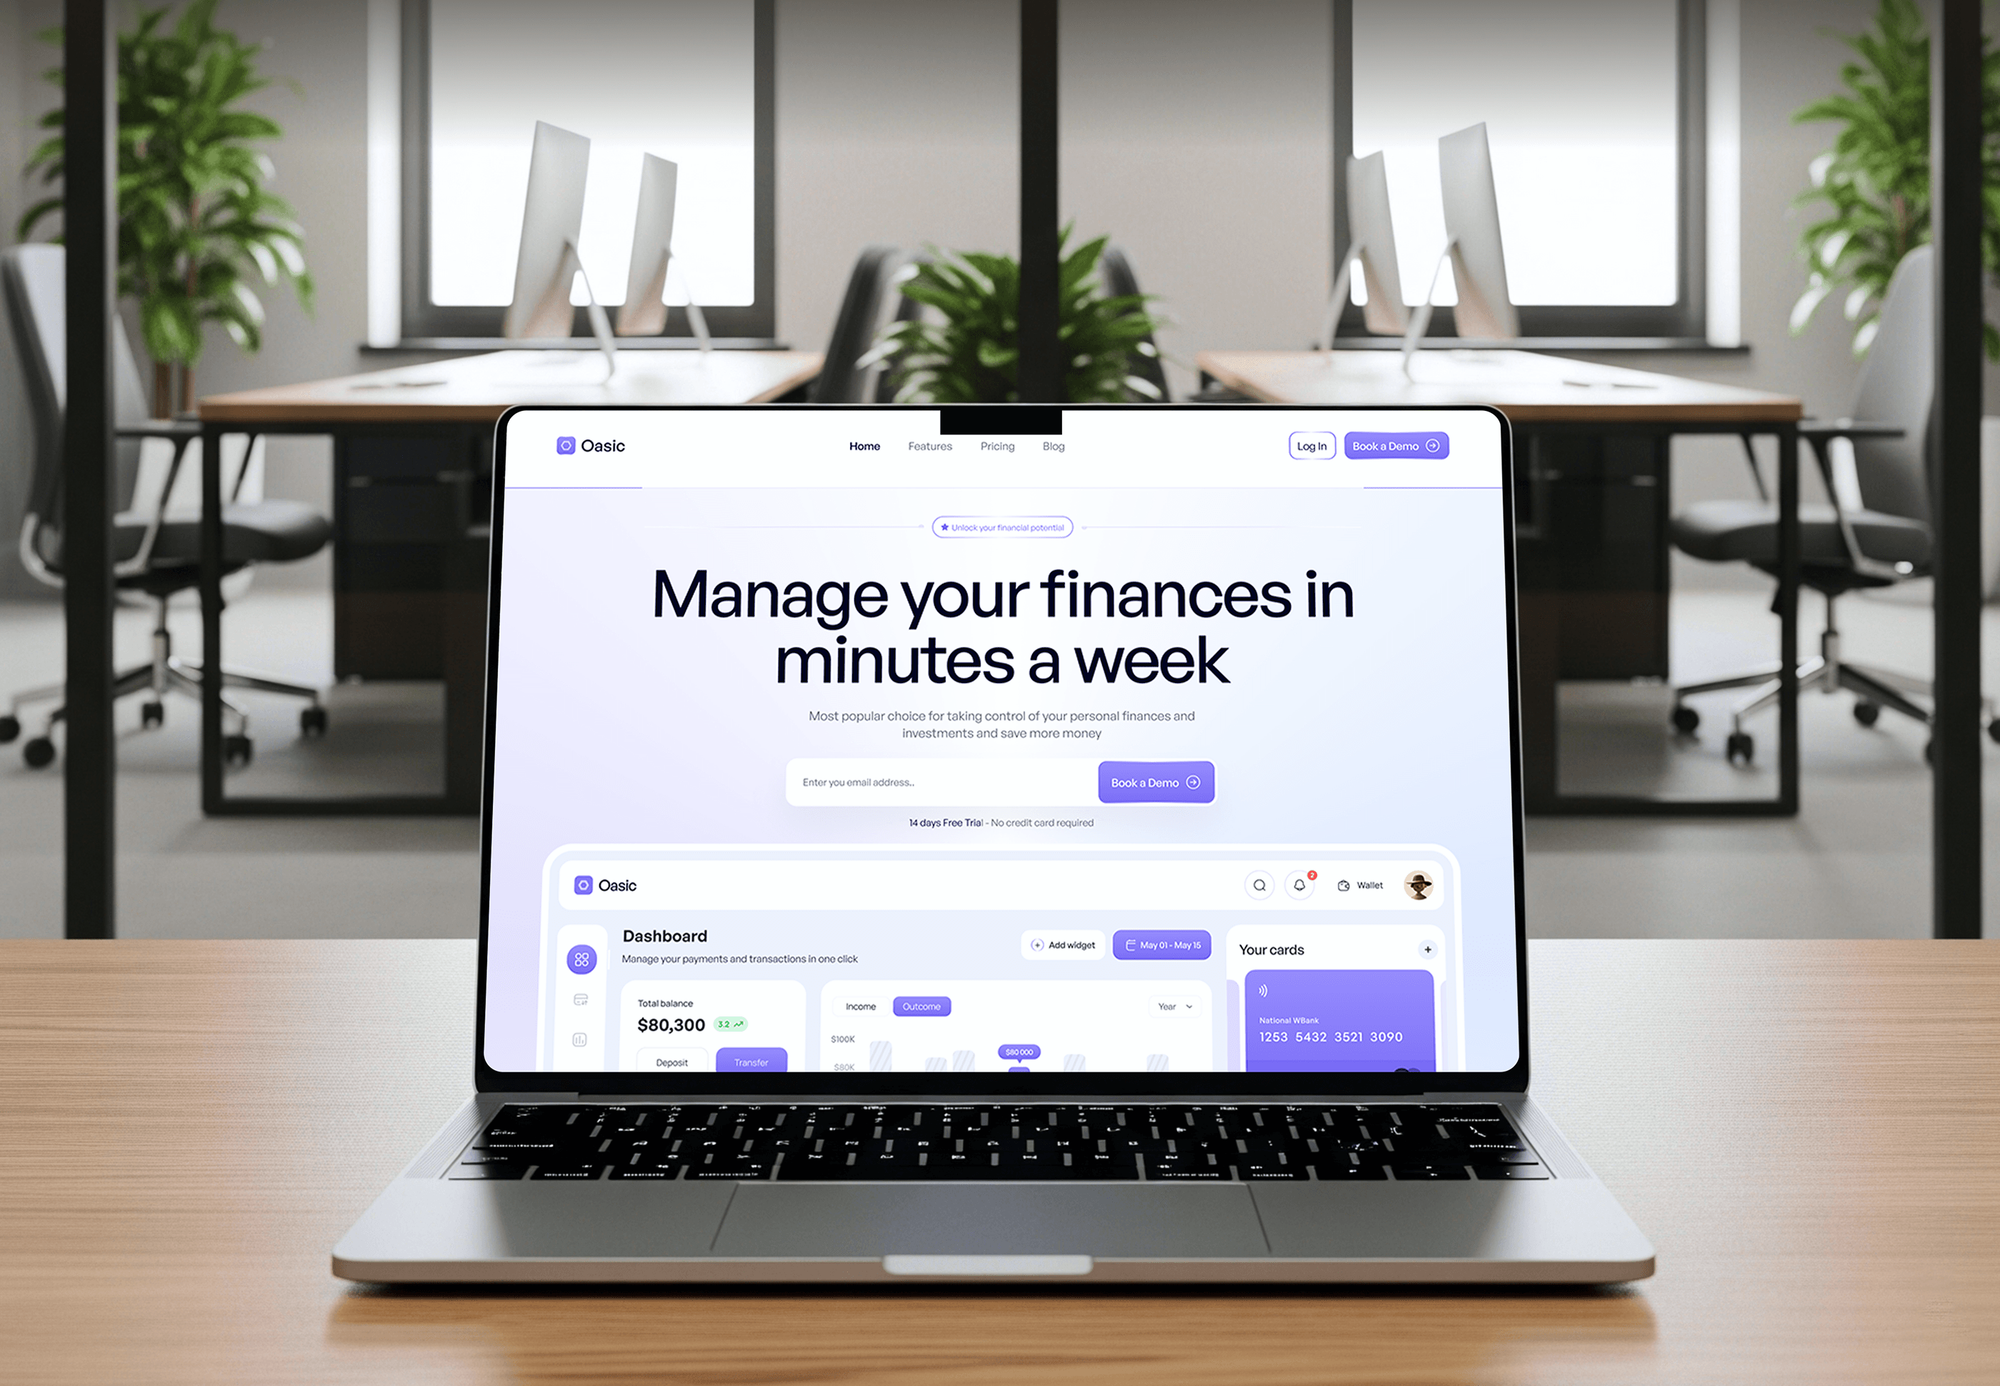
Staffic, Logify, Oasic, and Voltz are monitoring, tracking, and dashboard products we built. They show our data and alerting work, and none of them is an energy system.

What Our Clients Say
Feedback from teams we have built dashboards, monitoring tools, and data platforms for.
We had a pretty specific idea of what we wanted our website to become, but I wasn’t sure how easily we could explain all of it to a development team. There were quite a few moving parts, and we were working toward a deadline, so I expected a few things to get lost along the way. That never really happened. They understood what we were trying to achieve, kept us updated throughout the process, and got everything ready within the agreed timeline. The final site feels much easier to navigate, works beautifully on mobile, and is noticeably smoother for our customers. It was a huge relief seeing the original idea actually turn into the website we had in mind.
The mobile experience is probably my favourite part of the new site. We had spent a lot of time making sure the desktop version looked right, and the team kept pushing us to think about how everything would actually feel on a phone too. They were right. The navigation is clean, the interactions feel natural, and everything we’ve tested so far works exactly as it should. They also went through the links, forms, integrations, and other details more than once before launch, which I really appreciated. And even after going live, we could still reach out when something came up. The whole process felt friendly, organised, and surprisingly straightforward.
What I appreciate most is that the website is actually easy for us to manage now. We can update content ourselves instead of sending a developer a message every time we need to change something small. They also paid attention to the technical SEO side, which mattered to us because we didn’t want a new website to create problems for the traffic we already had. I’ve probably asked more questions than I should have since launch, but every question has been handled patiently and without any fuss. The team is easy to work with, they explain things clearly, and when we need something changed, they focus on getting it done rather than making the process complicated.
1,250+
Projects shipped
10+
Years of experience
Top 3%
Upwork Top Rated Plus
5 stars
Average review score
1,250+
Projects shipped
10+
Years of experience
Top 3%
Upwork Top Rated Plus
5 stars
Average review score

Want results like these?
Tell us what you are building. You get a reply within 24 hours on business days, then a written estimate.
Work Culture
Your energy numbers end up in budgets, audits, and sustainability reports. These habits keep the data traceable, the alarms useful, and the system easy for your team to run.
We walk your meter list and building systems before we design a screen. Your dashboard then follows how energy really flows through your sites.
We store every reading as it arrived and clean it in a separate layer. When an auditor or your utility questions a number, you can trace it back to the meter.
Each baseline states its period, its weather source, and the variables it adjusts for. Your savings figures then hold up in an ISO 50001 audit or a budget meeting.
We read building and plant data without writing setpoints unless your scope asks for it. Your operations team keeps control of the equipment.
If an energy SaaS already covers your meters and reports, we'll tell you before we quote. A custom build pays off when your sites don't fit its templates.
The database, source code, and cloud accounts are yours from day one. Your meter history stays with you, with no export fee and no license per meter.
Overview
DeveloperLook delivers custom energy management software development for facility, property, and plant teams. We connect utility interval data, submeters, and BACnet or Modbus systems, then build dashboards, alarms, weather-normalized baselines, and ISO 50001 or ENERGY STAR reports. Projects start at $1,450, take 7 to 18 weeks, and you own the code and data.
DEVELOPERLOOK
Project facts · Energy Management Software Development
Reviewed 29 Oct 2026 by Saimul Islam
Good fit
Multi-site facility and property teams
Your team runs offices, schools, or stores, and you want building energy management software that shows every site's usage and cost in one place.
Manufacturers with energy-heavy lines
You run compressors, ovens, or chillers, and you want industrial energy management software that ties energy use to each production line and shift.
Companies working toward ISO 50001
Your company is putting ISO 50001 in place, and you need an energy baseline, performance indicators, and records an auditor can follow.
Energy consultants and service companies
You deliver efficiency projects for clients, and you want your own platform for measuring savings instead of a new spreadsheet for each contract.
Agencies with an energy client
Your agency built a utility or energy client's website, and that client now wants a customer portal with usage data behind a login.
Not a fit
Running EV chargers
You need software that runs chargers, charging sessions, and driver payments. Our EV Charging App Development page covers OCPP backends and driver apps.
Solar sales and proposals
You need homeowner savings estimates or solar proposals. Our Solar Calculator for Website and Aurora Solar Integrations pages fit that work better.
A few sites, standard meters
You have a handful of sites on one utility and need basic tracking. An energy SaaS subscription will cost less, and we'll tell you before we quote.
Budget under $1,450
Your budget is under $1,450 for the whole system. Your utility's online portal or the free ENERGY STAR Portfolio Manager may serve you until you need alarms.
Not sure we're the right fit?
Book a free call or message us. We'll tell you honestly whether we're the right team.
Pricing
These are starting points in USD. Your final price depends on your sites, the meters and systems to connect, and your reports, and you get a fixed proposal after a free meter inventory.
For Agencies
You own the client relationship. We supply the engineering behind the energy dashboards and customer portals your clients ask for, under your brand. You get meter connections, alarm rules, and data notes your client's facility team can follow.
White label: your client only ever sees your brand
Send the client's sites, meters, and reports, and we shape the scope.
You get a fixed proposal in your agency's name and a named team.
We build, check totals against the bills, and hand over code and documents.
Send the client's sites, meters, and reports, and we shape the scope.
You get a fixed proposal in your agency's name and a named team.
We build, check totals against the bills, and hand over code and documents.
The Right Technology for Your Project
We use stacks your IT team can support, read meters in the protocols they already speak, and keep readings in a time-series database you own.
 Python
 Node.js
 React
 PostgreSQL
 AWS
 Microsoft Azure
 Docker
 Power BI
Related Services
EV charging and solar tools from this category, BI dashboards and data pipelines for wider reporting, and OT security for the plant networks you connect.
This page
Energy Management Software Development
Pairs with the 6 services around it
FAQ
Straight answers on what energy software does, cost, timelines, choosing a system, meter data, and ownership.
Saimul IslamFounder & CEO, DeveloperLookStill have questions?
Send a message or book a call with the team.
Energy management software is a system that collects energy data from utility meters, submeters, and building equipment and turns it into usage, cost, and alerts. Facility teams use it to find waste, compare sites, and prove savings. A custom build fits your own meters, sites, and reports.
Its purpose is to show where your energy goes so you can cut waste and cost. It spots loads running outside operating hours, warns about demand peaks before they set the month's demand charge, and tracks savings from each project. It also keeps the records ISO 50001 or ENERGY STAR benchmarking needs.
A custom system at DeveloperLook starts at $1,450 for up to 5 sites with utility data import, a dashboard, alerts, and a monthly report. A building platform for up to 25 sites with submeters, BACnet or Modbus points, alarms, and Portfolio Manager sync starts at $4,100. An enterprise system for up to 100 sites starts at $8,600. You get a fixed quote after a free meter inventory.
Custom energy management software development takes 7 to 18 weeks from meter inventory to launch. A utility data dashboard for a few sites takes about 7 to 9 weeks. Adding submeters and building systems runs 11 to 14 weeks, and an enterprise system takes up to 18. Gateway installs on site are usually what moves the date.
Choose it by listing your meters, building systems, sites, and the reports you owe, then testing each option against that list with your own data. Check which utilities and devices it reads, how it handles missing readings, and whether you can export everything. Compare total cost over several years, fees included.
For factories, choose software that ties energy to production, not just to the building. It should read plant meters and equipment over Modbus or from your historian, normalize use per unit produced, and report by line or shift. Industrial energy management software also needs read-only access to plant networks, which your OT team should approve first.
The best software is the one that reads your meters and produces your reports without workarounds. For a few sites on standard utilities, an energy SaaS subscription is often the best value. Energy management software companies that build custom systems make sense when your sites, equipment, or reporting rules don't fit those templates.
It reduces costs by catching waste that monthly bills hide. Schedules flag lighting, HVAC, or compressed air running after hours, demand alarms warn before a peak sets the month's charge, and baselines show which projects really saved energy. Alarms sent to your work order tool reach the right technician.
It reads utility data from portals or Green Button files and reads submeters and equipment through a gateway on your network. The gateway talks BACnet or Modbus to your building and plant systems and sends readings to the cloud over an outbound connection. No inbound port gets opened.
You do. The database, source code, and cloud accounts are yours from day one, and you can export every reading at any time. After launch you get 60 days of post-launch support for fixes, new meters, and small changes. After that, keep us as your energy management software development company for new sites, or hand the system to your own team.
Saimul IslamFounder & CEO, DeveloperLookStill have questions?
Send a message or book a call with the team.
Free 30-min callGoogle Meet
Book a call
In 30 minutes on Google Meet we walk you through how we would build it, how long it takes and what it costs. Then you get a written estimate.
Calendar not showing? Book on cal.com or send a brief.