




Data readiness report
Gaps, duplicates, and recording changes in your history, with a clear go or no-go before any modeling.

For operations, sales, and finance teams who plan from spreadsheets: forecasts and risk scores built on your own history and tested before you rely on them.
90days
Forecast horizon for planning
12months
Backtested before go-live
How your project runs
01 · FreeTeams we have built for:













The Problem
It surfaces at planning time: a buyer orders stock from last year's sales, a manager guesses which accounts might cancel, and finance builds a budget on a growth rate nobody can defend.
Stock orders
Reorders copy last year's sales plus a hopeful margin.
Stock orders
Demand forecasts by product and week, refreshed from your latest orders.
Surprise churn
Cancellations arrive before anyone spots the warning signs.
Surprise churn
A risk score for each customer flags the accounts to call this week.
Lead order
Sales works leads in arrival order, not by fit.
Lead order
Lead scores inside your CRM rank who is most likely to buy.
Trust gap
Nobody believes the forecast, so the team quietly ignores it.
Trust gap
Backtests show where the model is right and wrong before it goes live.
Your buyer reorders from last year's sales plus a hopeful margin. Best sellers run out before the promotion ends, while slow lines fill the warehouse. Customer success learns an account was unhappy when the cancellation email lands. Sales calls leads in the order they arrived, not by who is likely to buy. Finance keeps three spreadsheets with three different growth rates. The data to see all of this coming already sits in your store, CRM, and accounting tools. Nobody has turned it into a forecast the team trusts.
We start with one decision, such as what to reorder, which customers to call, or how many staff to schedule. Then we build a simple baseline and a machine learning model on your own history, and backtest both on your most recent 12 months. You see where each one is right and wrong before anyone relies on it. The winning forecast lands where the decision gets made, not in a slide deck.
One decision at a time
Each model answers one business question, so the result is easy to act on and easy to check.
Backtested on your history
Forecasts are scored against your last 12 months before your team relies on a single number.
Forecasts where you decide
Results land in your dashboard, CRM, or a weekly email instead of a one-off slide deck.
Our Predictive Analytics Services Process
You choose the decision, review the data check, see the backtest results before anything goes live, and approve where the forecast appears for your team.
We talk through the decision you want to improve, the data you have, and how your team plans today. You get an honest view of whether a model can beat your current method, plus a written scope and a fixed price.
What's Included
Everything needed to go from raw history to a forecast your team uses every week: the data check, the models, the backtest, the pipeline, and a clean handover.
Compare Options
A BI tool's built-in forecast and a data scientist on staff both suit some teams. Here is how they compare on the work that decides whether a forecast gets used.
| Feature | DeveloperLookBest fit | BI Tool Forecast | In-House Hire |
|---|---|---|---|
| Planning | Starts from one decision | Starts from a chart | Starts from a backlog |
| Data preparation | Cleaned and checked first | Uses data as it is | Done in-house, over time |
| Model choice | Baseline plus tested ML models | One built-in method | Wide, depends on the hire |
| Backtesting | 12 months, by segment | Rarely shown | Depends on the person |
| Setup speed | 3 to 12 weeks | Minutes inside the tool | Months to hire and ramp up |
| Where results land | Dashboard, CRM, or warehouse | Inside the BI tool only | Wherever they build it |
| Cost | Fixed price per scope | Included in your licence | Full salary and benefits |
| Ownership | Code and model card you keep | Tied to the tool | Knowledge sits with one person |
Projects We've Built
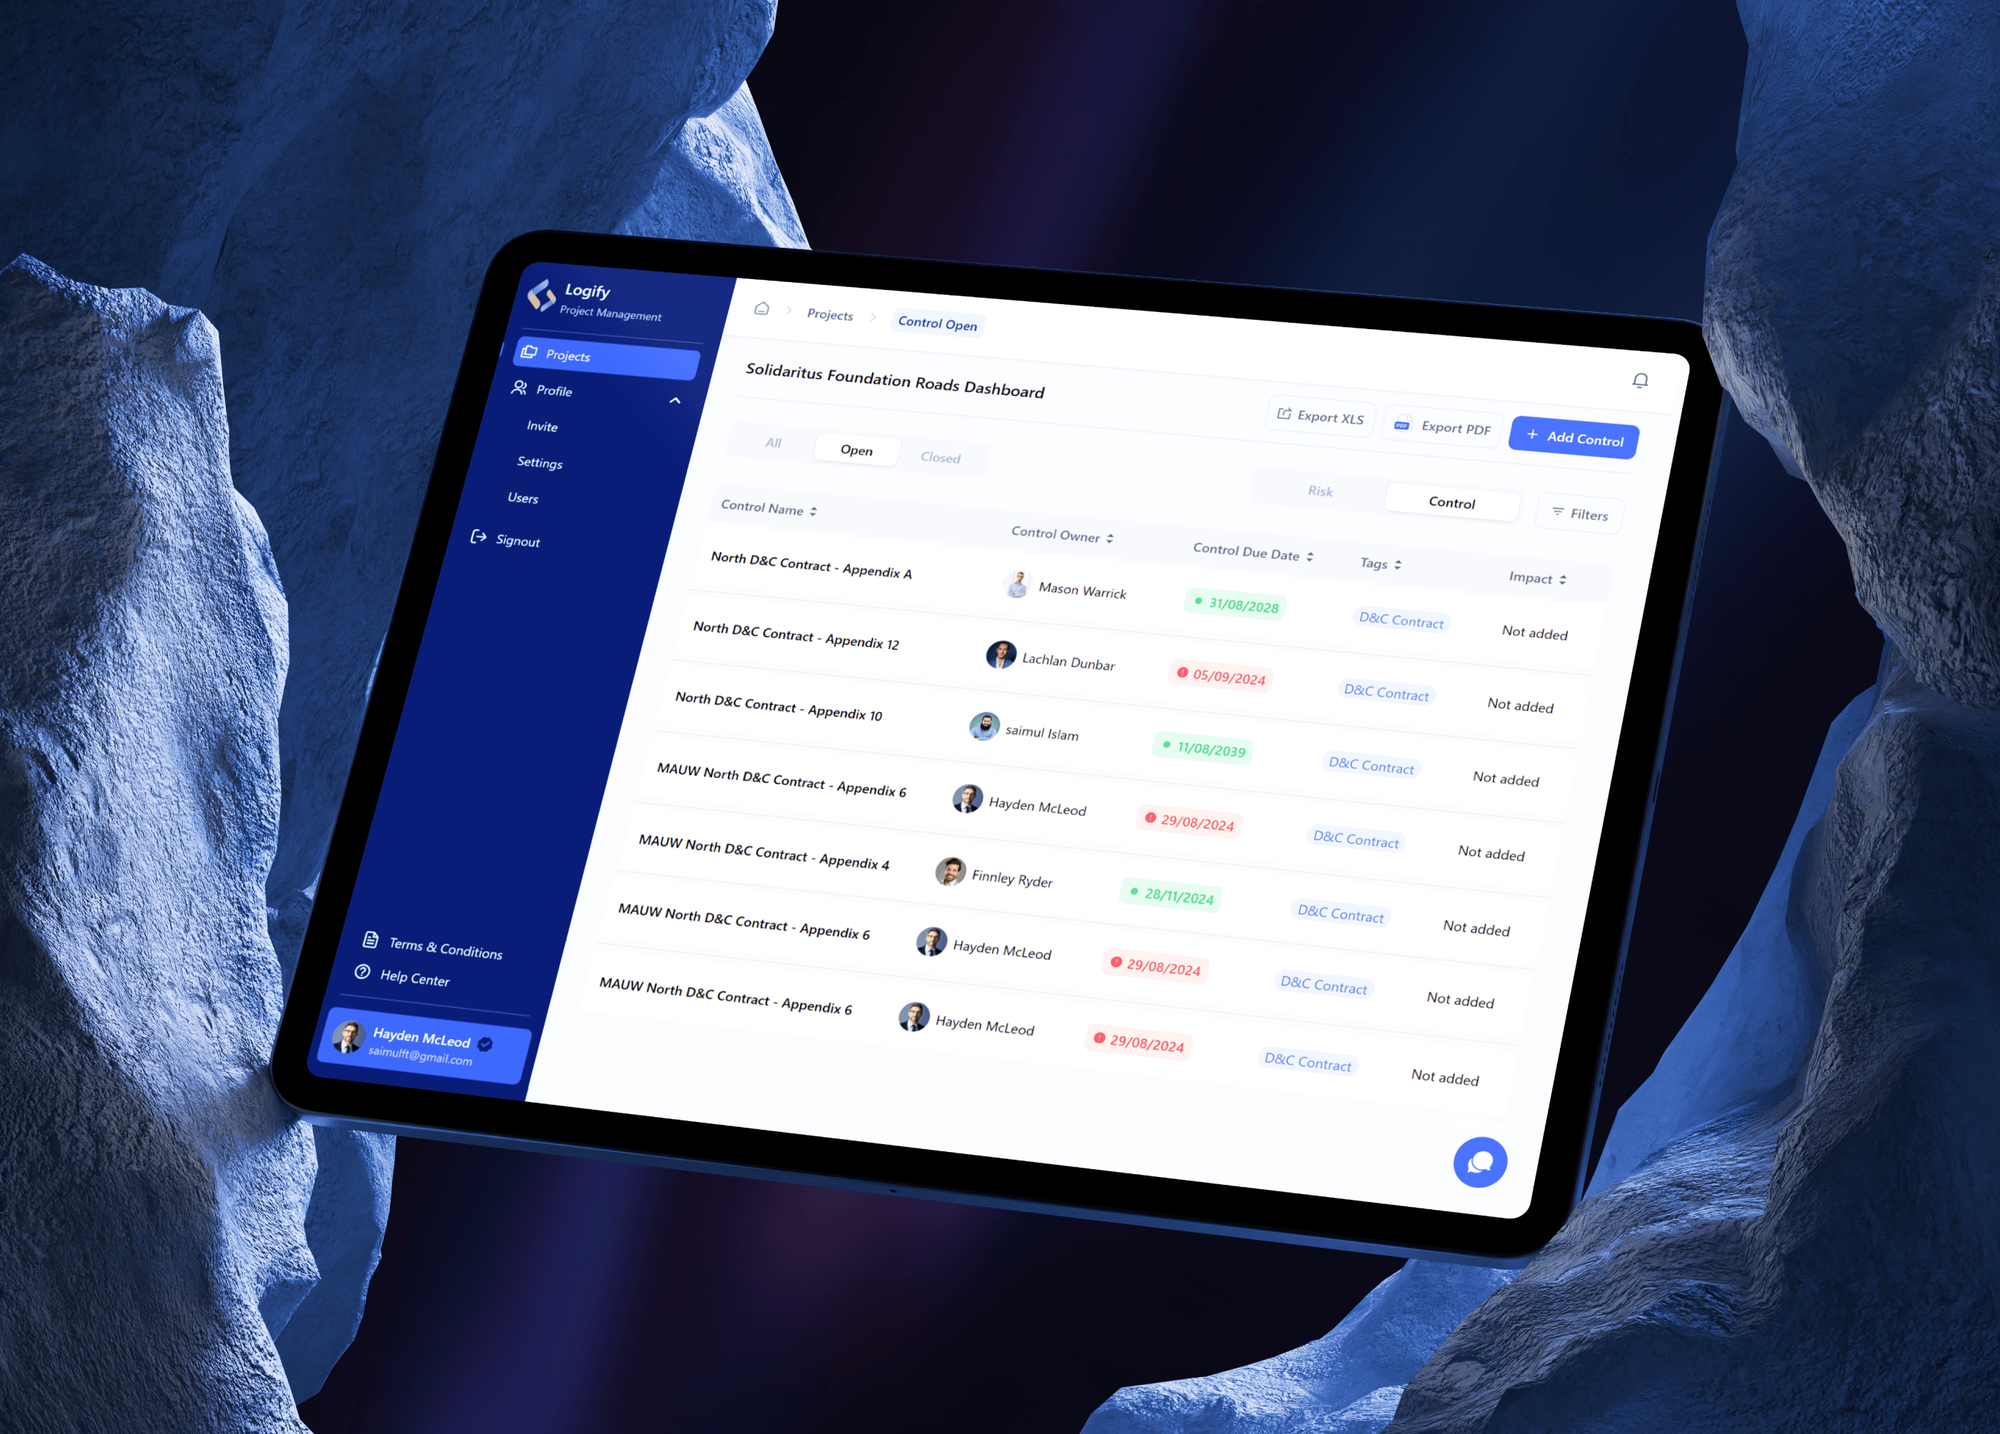
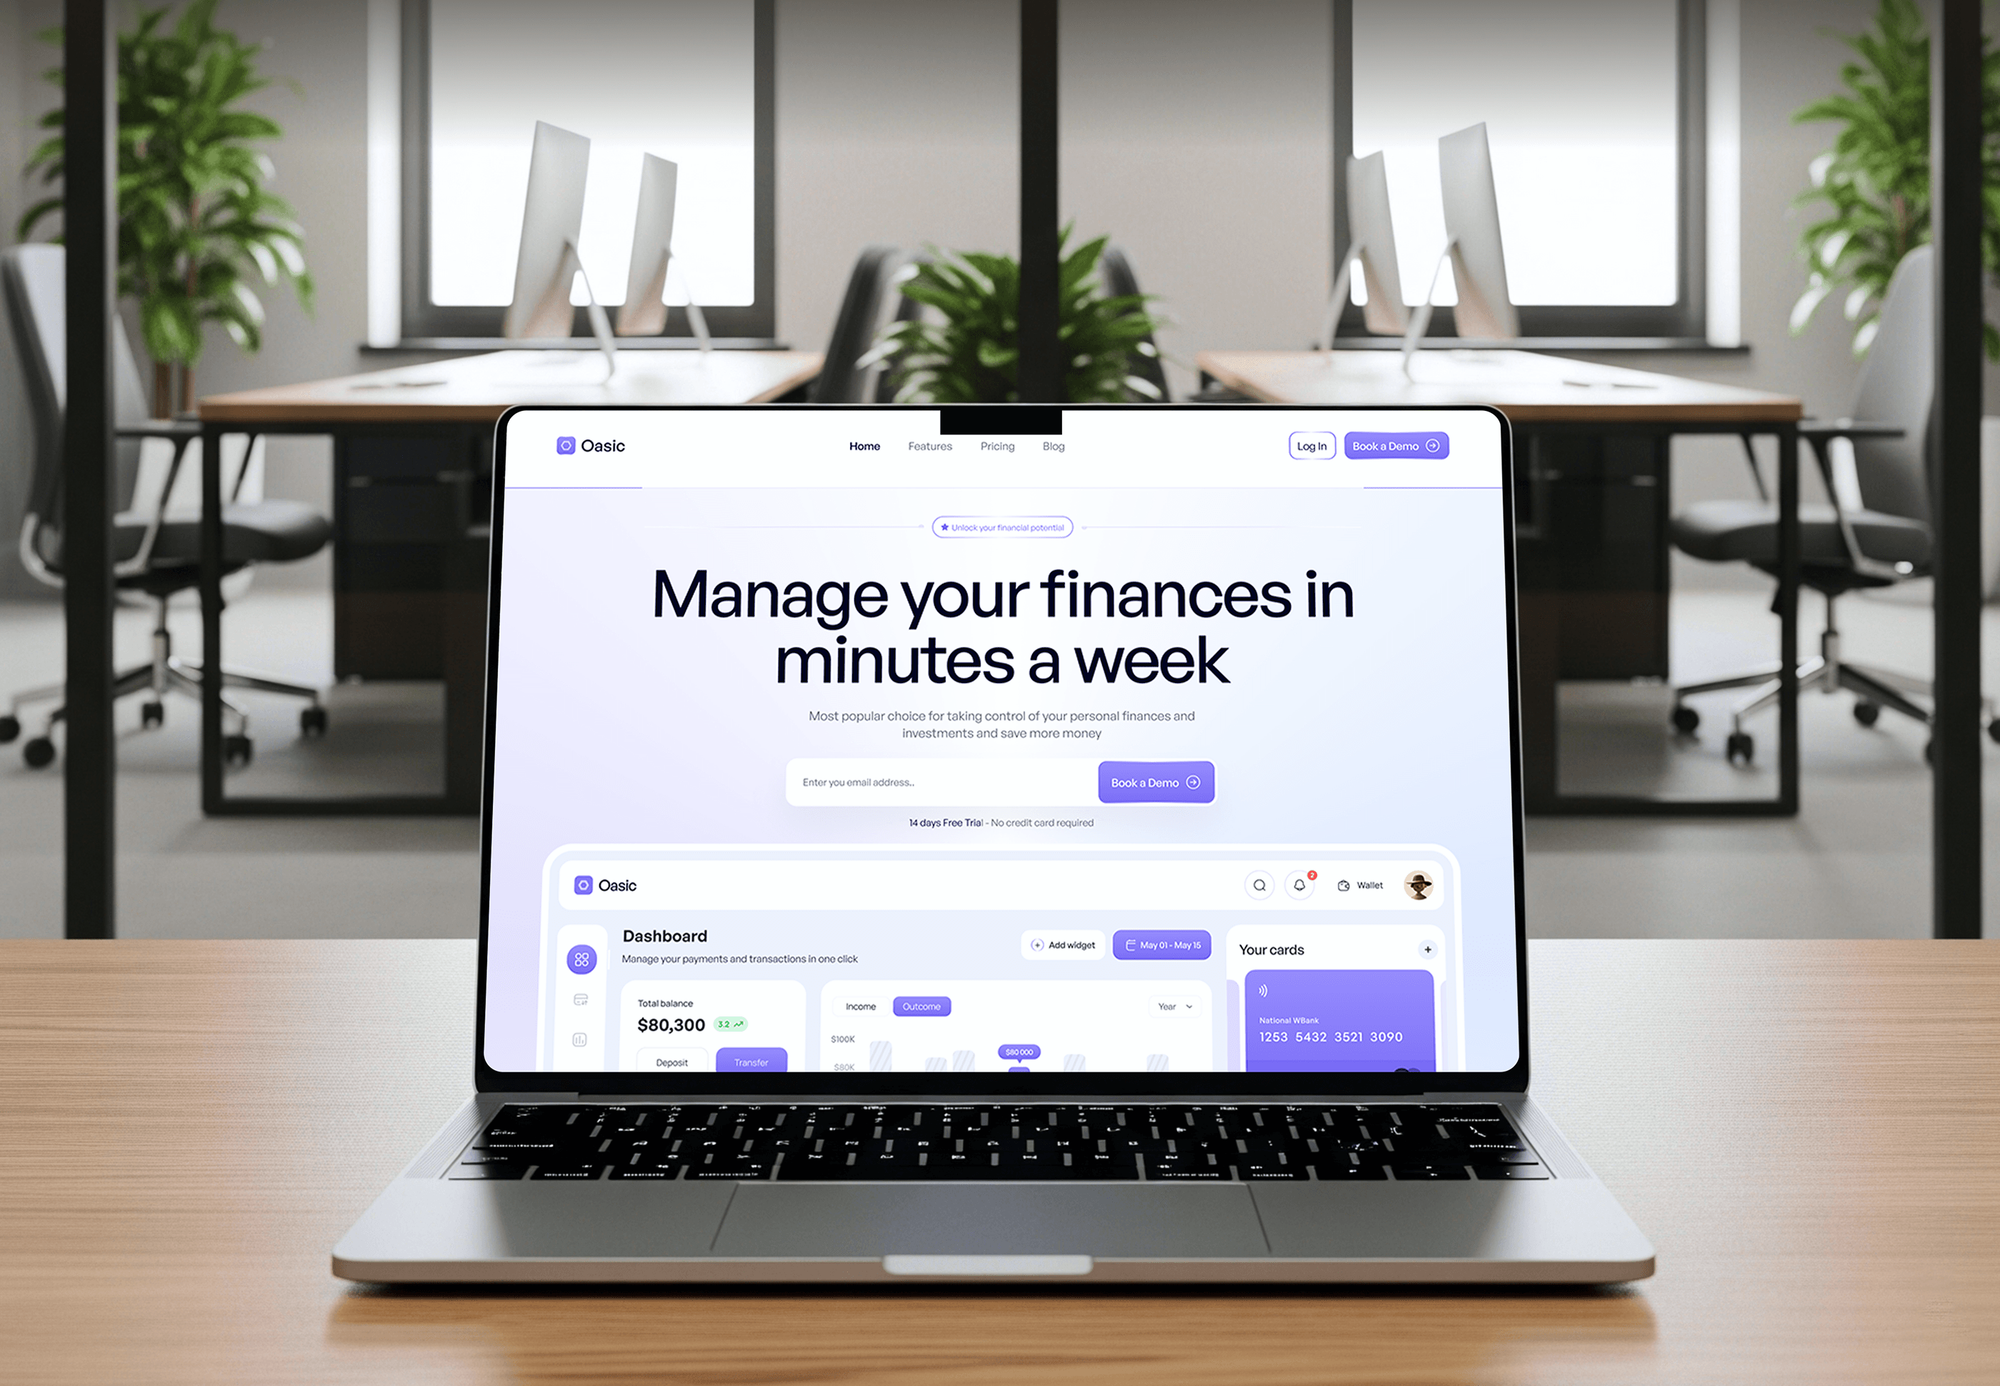
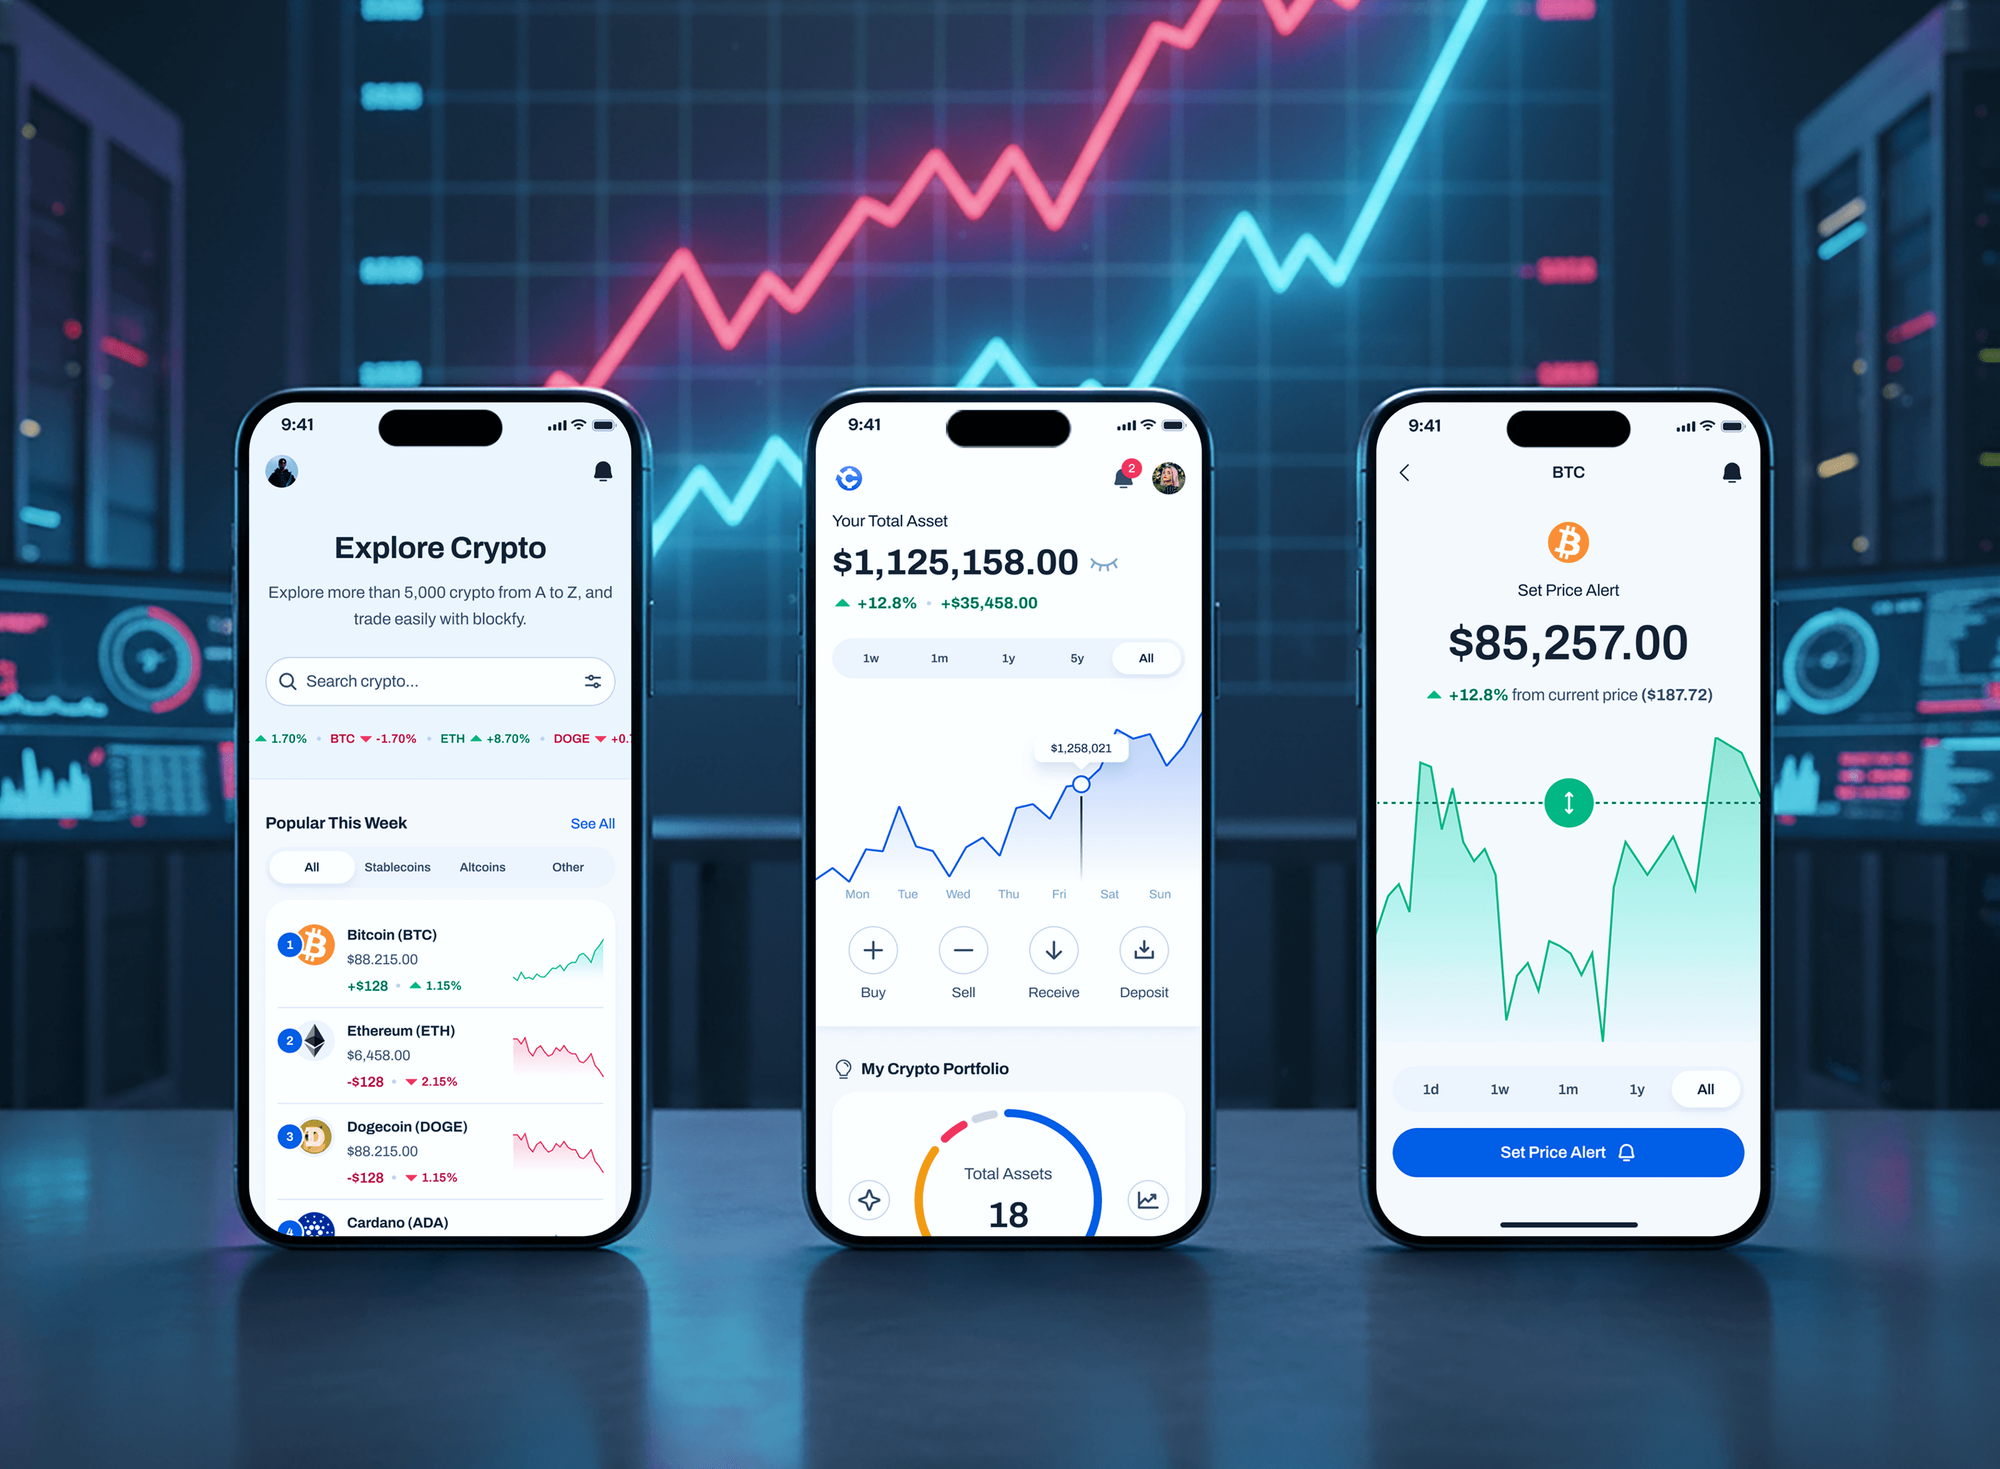
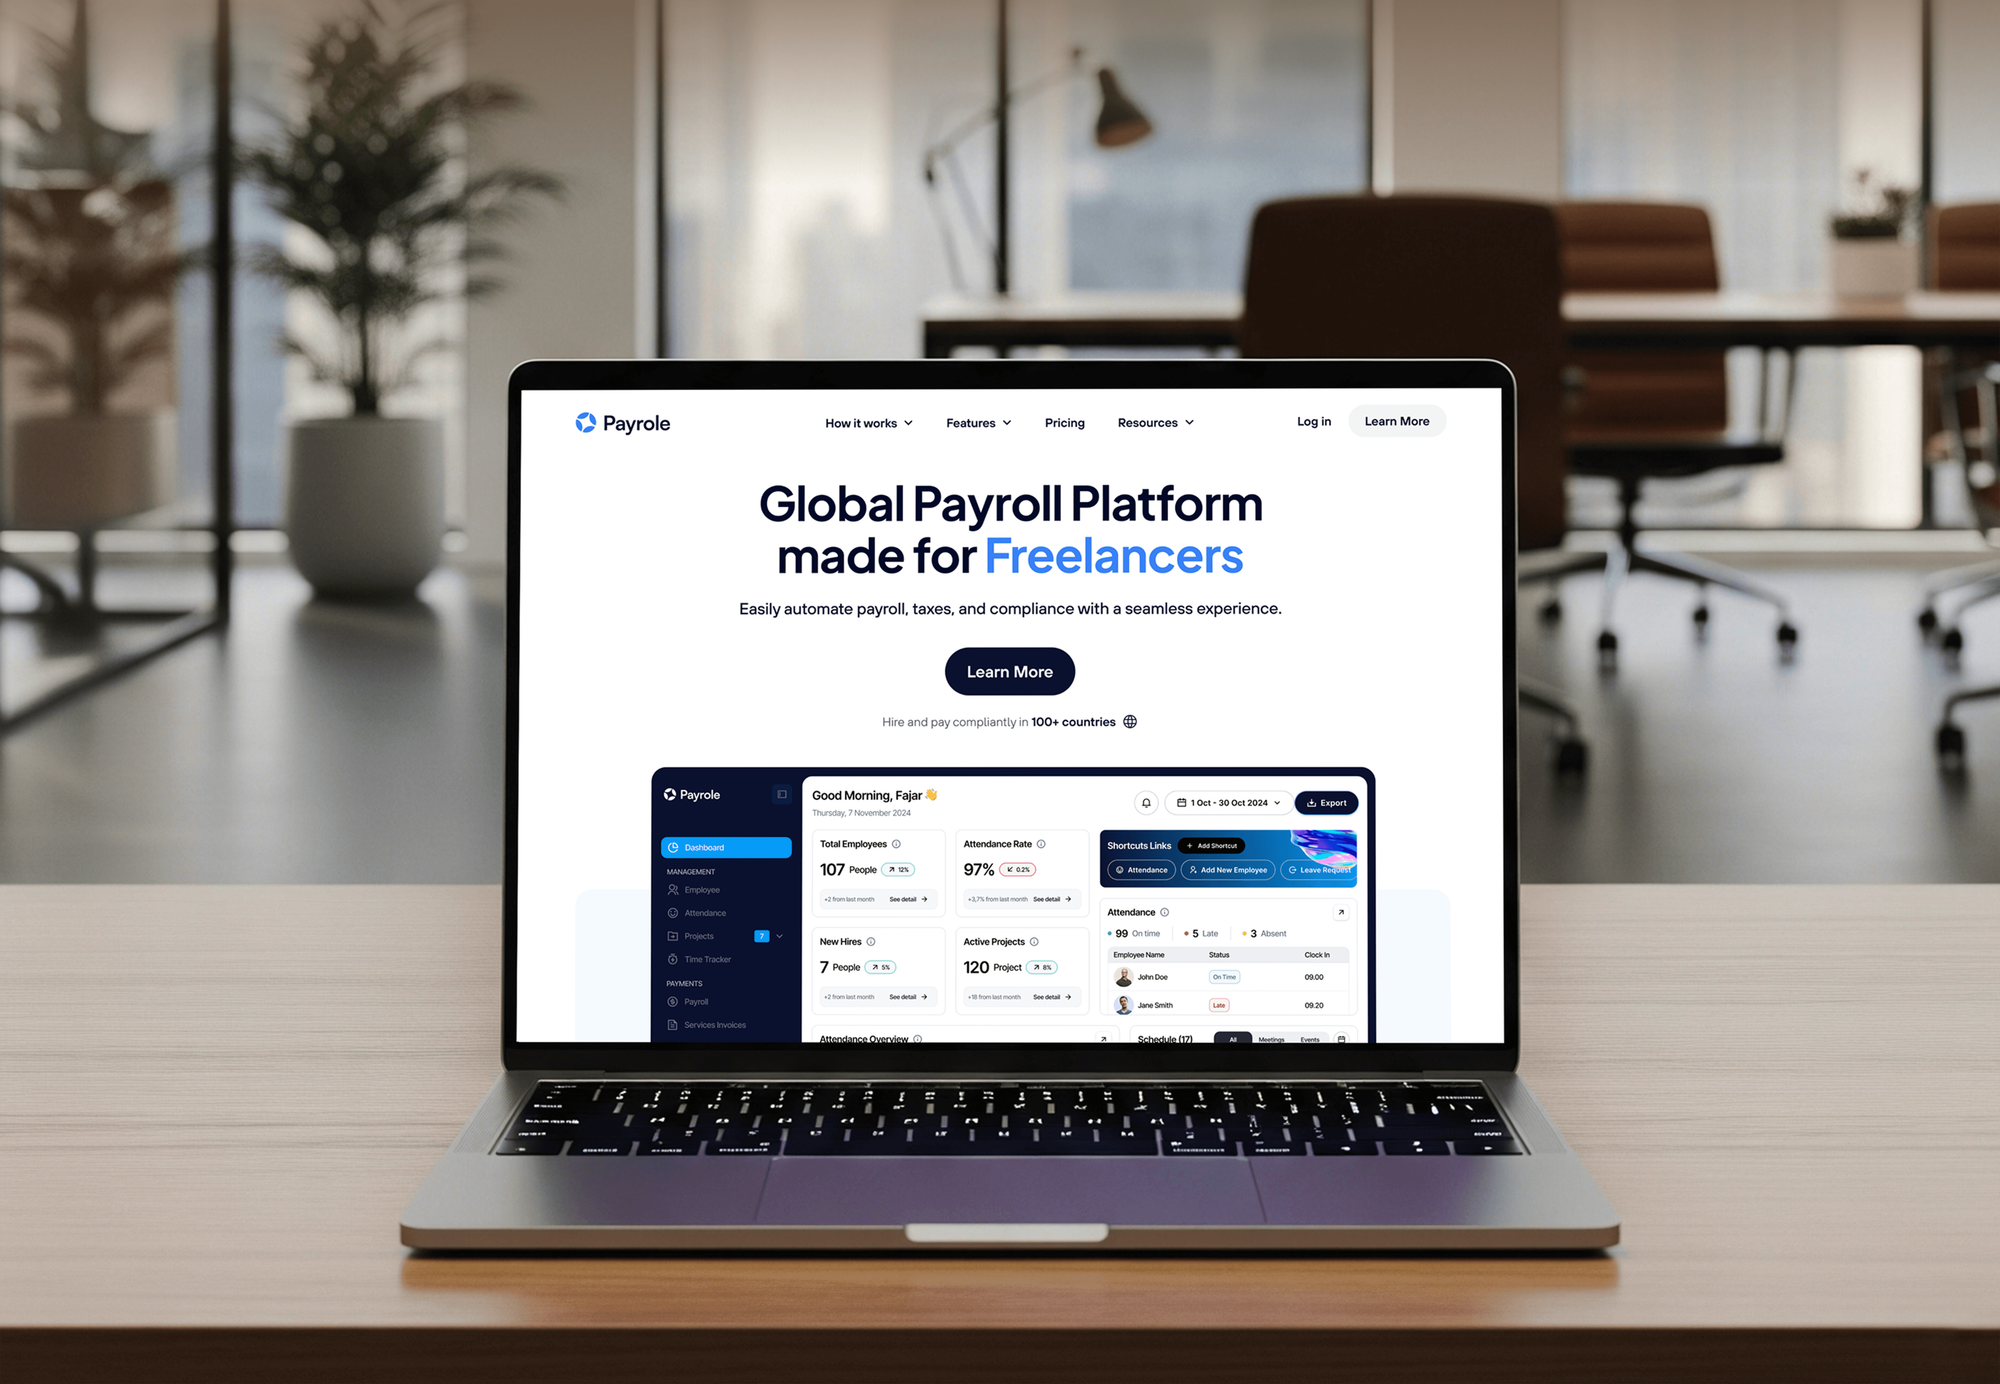
Dashboards and apps we designed and built that track money, risk, and activity over time. They show our build work, not past forecasting projects.
What Our Clients Say
Feedback from teams we have built apps, platforms, and websites for.
We had a pretty specific idea of what we wanted our website to become, but I wasn’t sure how easily we could explain all of it to a development team. There were quite a few moving parts, and we were working toward a deadline, so I expected a few things to get lost along the way. That never really happened. They understood what we were trying to achieve, kept us updated throughout the process, and got everything ready within the agreed timeline. The final site feels much easier to navigate, works beautifully on mobile, and is noticeably smoother for our customers. It was a huge relief seeing the original idea actually turn into the website we had in mind.
The mobile experience is probably my favourite part of the new site. We had spent a lot of time making sure the desktop version looked right, and the team kept pushing us to think about how everything would actually feel on a phone too. They were right. The navigation is clean, the interactions feel natural, and everything we’ve tested so far works exactly as it should. They also went through the links, forms, integrations, and other details more than once before launch, which I really appreciated. And even after going live, we could still reach out when something came up. The whole process felt friendly, organised, and surprisingly straightforward.
What I appreciate most is that the website is actually easy for us to manage now. We can update content ourselves instead of sending a developer a message every time we need to change something small. They also paid attention to the technical SEO side, which mattered to us because we didn’t want a new website to create problems for the traffic we already had. I’ve probably asked more questions than I should have since launch, but every question has been handled patiently and without any fuss. The team is easy to work with, they explain things clearly, and when we need something changed, they focus on getting it done rather than making the process complicated.
1,250+
Projects shipped
10+
Years of experience
Top 3%
Upwork Top Rated Plus
5 stars
Average review score
1,250+
Projects shipped
10+
Years of experience
Top 3%
Upwork Top Rated Plus
5 stars
Average review score

Want results like these?
Tell us what you are building. You get a reply within 24 hours on business days, then a written estimate.
Work Culture
A forecast is only useful when planners trust it and can see why it changed. Six habits keep our models honest, explainable, and in daily use.
Every model has to beat a simple baseline, such as the same week last year, on your own data. If it can't, you keep the simple version and save the cost.
If your history is too short or too messy, the readiness report says so. When your BI tool's built-in forecast covers your case, we'll tell you before we quote.
Planners see the main drivers behind each forecast in plain English. A number nobody can explain gets ignored, however accurate it is.
We report accuracy only from backtests on your own data, by product or segment. No vendor benchmark gets dressed up as your result.
We connect to your systems with read-only credentials wherever we can. Customer data stays in your cloud account, not on our laptops.
Code, trained models, and the pipeline live in your repository and cloud. Your team can retrain or replace them without us.
Overview
DeveloperLook provides predictive analytics services that turn your sales, customer, and operations history into forecasts and risk scores. We check your data, build and backtest models against a simple baseline, and deliver results to your dashboard or CRM. Plans start at $1,250, pilots take 3 to 4 weeks, and you own the code and models.
DEVELOPERLOOK
Project facts · Predictive Analytics Services
Reviewed 28 Oct 2026 by Saimul Islam
Good fit
Ecommerce and retail inventory teams
Your best sellers run out while slow lines sit in the warehouse, and you want demand forecasts by product before the next purchase order goes out.
Supply chain and operations leads
You want predictive analytics in supply chain planning: lead times, reorder points, and stock levels that react to real demand instead of averages.
Subscription and SaaS businesses
Your churn shows up as a surprise each month, and you want a weekly list of accounts at risk while there's still time to help them.
Sales teams with too many leads
Your reps work leads in the order they arrive, and you want scores in Salesforce or HubSpot that rank who's most likely to buy.
Agencies and analytics consultancies
Your client wants predictive analytics consulting plus a working model, and you need a white-label team that builds, backtests, and documents it.
Not a fit
Budget under $1,250
You want a forecast, but your budget is under $1,250. Your BI tool's built-in forecast or a spreadsheet trend line is a fair place to start.
Under 2 years of history
You have less than 2 years of history. Seasonal forecasts need older data to learn from, so start with Data Engineering Services to capture it cleanly.
Only need past reports
You mainly want clear reports of what already happened. Data Visualization Services covers dashboards without the cost of modeling.
Unsure where AI fits
You haven't picked the decision to improve yet. AI Consulting Services ranks the options first, so a model gets built only where it can pay off.
Not sure we're the right fit?
Book a free call or message us. We'll tell you honestly whether we're the right team.
Pricing
These are starting points in USD. Your final price depends on your data sources, model count, and output systems, and you get a fixed proposal after a free discovery call.
For Agencies
You own the client relationship. We supply the data science behind it: the readiness check, the models, the backtests, and a forecast pipeline your team presents under your brand. Your client gets a working forecast, not a slide deck.
White label: your client only ever sees your brand
Send the decision, data sources, and deadline your client has, under NDA if needed.
You get a readiness plan, a timeline, and a fixed price you can mark up.
We build, backtest, and document the model, then hand it over to your team.
Send the decision, data sources, and deadline your client has, under NDA if needed.
You get a readiness plan, a timeline, and a fixed price you can mark up.
We build, backtest, and document the model, then hand it over to your team.
The Right Technology for Your Project
Proven open-source modeling tools, your existing warehouse, and the dashboards your planners already open, so forecasts fit into the week instead of adding a new tool.
 PostgreSQL
 Shopify
 Salesforce
 HubSpot
 Stripe
 Python
 PyTorch
 Power BI
 Google Sheets
Related Services
Services teams pair with forecasting: clean data pipelines, a proper warehouse, dashboards that show the results, and AI planning before the first model.
This page
Predictive Analytics Services
Pairs with the 6 services around it
FAQ
Straight answers on what predictive analytics is, how businesses use it, cost, timelines, and how it differs from other kinds of analytics.
Saimul IslamFounder & CEO, DeveloperLookStill have questions?
Send a message or book a call with the team.
Predictive analytics uses your past data to estimate what is likely to happen next, such as next month's demand or which customers may cancel. In machine learning predictive analytics, a model learns patterns from history, like seasonality, price changes, or how engaged a customer is. It then scores new data each day or week, so your team acts before the outcome arrives.
Businesses use it to forecast demand, flag customers at risk of leaving, score leads, plan staffing, and spot late payments. Retailers forecast sales by product and week. SaaS teams rank accounts by churn risk, and sales teams sort leads by the chance they'll buy. Each use starts from one decision and one source of history.
Our forecasting projects start at $1,250 for a pilot on one decision and one data source. A production forecast with a scheduled pipeline and dashboard starts at $3,700, and a program with up to 3 models starts at $7,600. Data cleanup is the biggest swing factor, and you get a fixed quote after the free discovery call.
A pilot takes 3 to 4 weeks from data access to backtest results. A production forecast that refreshes on a schedule takes 6 to 8 weeks, and a multi-model program takes up to 12 weeks. The readiness check in week one usually sets the pace, because messy history takes longer to clean than models take to train.
It helps a business make the same decisions earlier and with less guesswork. Buyers order closer to real demand, customer success calls at-risk accounts before they cancel, and finance plans cash from expected payments. The gain comes from acting sooner, so we put forecasts inside the tools where those decisions already happen.
It matters because most plans copy last year and add a guess, which hides shifts in demand until they cost money. A tested forecast shows a likely range instead of one hopeful number. Planners can then set stock, staffing, and budgets with a clear view of the risk on each side.
Use it when spreadsheet trends stop keeping up: many products, promotions, seasons, or customer behavior that keeps changing. A model weighs many signals at once and updates itself each week. If your spreadsheet trend already tracks reality well, keep it. Our backtest compares both on your data before you spend more.
The predictive side estimates what is likely to happen, while the prescriptive side recommends what to do about it. A demand forecast is predictive. A reorder quantity that weighs that forecast against lead times, costs, and shelf space is prescriptive. Most teams start with a trusted prediction, then add rules or optimization once planners rely on it.
Descriptive analytics reports what already happened, and a predictive model uses that same history to estimate what comes next. Your dashboards of past sales, churn, and leads are descriptive. A model trained on that data adds the forward view. Clean reporting comes first, because a model trained on wrong numbers forecasts wrong numbers.
The outcomes are working forecasts or risk scores, a backtest on your own data, and a pipeline that keeps both fresh. You also get the code, a model card listing inputs and limits, and a retraining guide. AI predictive analytics only pays off when planners use it, so we also train the people who read the numbers.
Saimul IslamFounder & CEO, DeveloperLookStill have questions?
Send a message or book a call with the team.
Free 30-min callGoogle Meet
Book a call
In 30 minutes on Google Meet we walk you through how we would build it, how long it takes and what it costs. Then you get a written estimate.
Calendar not showing? Book on cal.com or send a brief.